Analysis | June 22, 2022
Keep Calm and Carry On – 10 Reasons to Stay Invested in High Yield

Capital at risk. The value of investments and the income from them may fall as well as rise and is not guaranteed. Investors may not get back the full amount invested.
Despite the heavy price action we have witnessed in the high yield market since the start of the year, we believe high yield investors should hold firm and potentially consider adding to their exposure at what we believe could be an attractive entry point into the asset class
The high yield market is down over 12%1 this year due to rising sovereign yields and spread widening associated with slowing economic expectations. Fig. 1 illustrates just how far the market has moved.
However, while the market has been weak, we believe the current environment warrants closer attention.
Fig. 1 – Developed Market High Yield Has Sold Off Year to Date
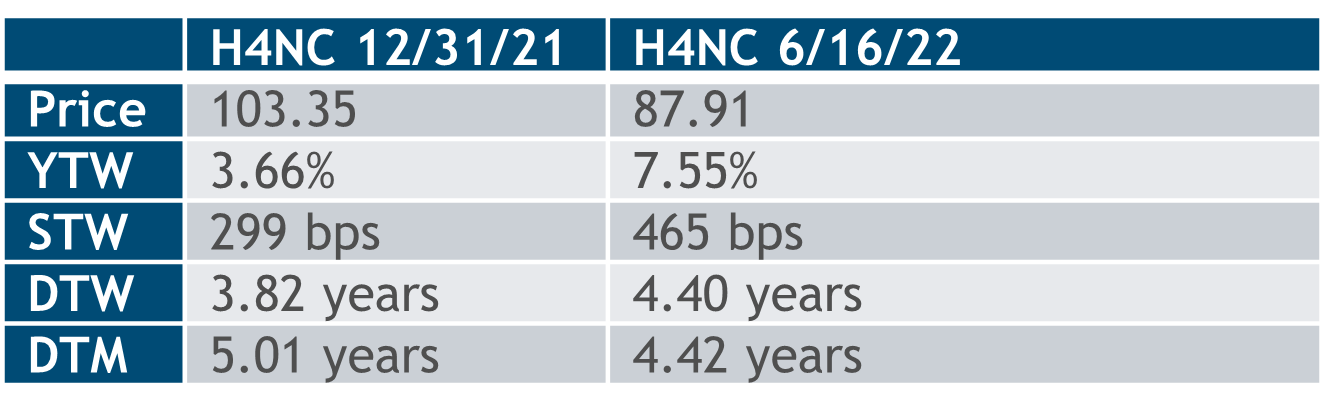
Source: ICE Index Platform. ICE BofA BB-B Global Non-Financial Developed Markets High Yield Constrained Index (H4NC), as of 16 June 2022. For illustrative purposes only.
1.High Yields
Only 4 times over the last 20 years have yields been higher than now, in the 2002 corporate fraud wave, the great financial crisis (GFC) in 2008-2009, the European sovereign crisis in 2011 and the 2020 Covid crisis.1 Current yields are consistent with the 2016 high associated with the US energy crisis. Thus, yields are near their 20-year high percentile range.
2.Spreads Above 10-Year Average
Spreads are above their 20-year average at 465 bps versus 448 bps, but they are materially above the 10-year average of 387 bps.1 The 10-year average is an important focus area given the maturity of the market today versus pre-GFC, and the fact that we consider the GFC to be a 100-year event and unlikely to happen again in the foreseeable future.
3.Low Dollar Price
Dollar prices have only been lower than the current level 3 times over the last 20 years: the 2002 corporate fraud scandal, the GFC and 2020 Covid era.1
4.Higher Rating than pre-GFC
The asset class now carries a BB3 rating versus B1 pre-GFC; we are higher rated than before the largest correction.1
5.Strong Credit Metrics
US high yield leverage is less than 4.5x gross with a net of almost 3.5x. This is a function of a US market that is at a 20-year high in BBs and a 20-year low in CCCs as well as issuers maintaining large cash balances in the post-Covid era. 2 Interest coverage is approaching 6x in the US and may decline to 4.75-5.00x in 2023 in a slowing economy/rising rate environment.3 Liquidity and leverage are not an issue right now because the weak companies failed in 2020-2021, while the strong issuers became leaner.
6.No Wall of Maturities
The market is NOT exposed to near-term maturities. The coupon can cover US maturities through 2024.4
7.DTW and DTM aligned
The market DTW is in-line with the DTM (See Fig 1.); in our opinion the changing duration picture of the market is behind us. Convexity is now in our favor.
8.Further Spread Widening Would Result in a Flat Return on a 1-Year Basis
The current average yield of the market is 5.69%.1 We believe if spreads widened 130bps from current levels the asset class would post a flat return over 1 year. Spreads only exceeded 600 bps during the Covid peak from March-May 2020 and the US energy crisis from December 2015-March 2016 over the past 10 years.1
9.Default Rates Near Historic Lows
While default rates will rise as the economy slows, in our view they are unlikely to hit GFC levels given the low CCC percentage in the market, the low level of large leveraged buy outs (LBOs) in the market, and the recent 8%+ US default rate peak.2 Based on the current market, we believe a 3-5% rate could be achieved over the next 12-18 months, and this is likely already priced into current broad market spreads where CCCs are approaching 1,000 bps.
10.Less Liquidity in a Bear Market Makes Tactical Trading Challenging
Tactical trading in high yield can be challenging since not every issuer trades every day. Buying after a clear upturn will be challenging since brokers no longer carry inventory and everyone will be trying to buy. We believe the best time to buy in high yield is when managers are selling, and prices are going down while the best time to sell is when prices are going up and everyone is buying.
The global economy is slowing and there are potential recessionary clouds on the horizon. While it is impossible to say where the market will trade on any given day, it is clear that investors have taken pain in 2022 and the potential returns at this point are actually skewed more towards the positive than they were at the end of 2021.
In our opinion, longer-term investors with strong capital positions could consider the following options.
1.Ride out these levels and let the power of the coupon overcome short-term volatility.
2.Begin ADDING to positions and dollar-cost average down and YTW average up their holdings.
We believe selling today at current low dollar prices is locking in losses. In our view, high yield investors make almost all of their return over time due to the carry of being invested, if not over 100% due to default losses. This is in direct contrast to equities where investors make almost all of their total return from price movements.
We believe investors with a long-term perspective and stable capital are best positioned to achieve the long-term total return potential of the asset class offered by today’s levels. Time in the high yield market is more important than timing the high yield market over the long run.
<span>1.ICE Index Platform, as of 16 June 2022. Based on the ICE BofA BB-B Global Non-Financial Developed Markets High Yield Constrained Index (hedged USD).
<span>2. ICE Index Platform, as of 31st May 2021. ICE BofA US Cash Pay High Yield Index (J0A0), ICE BofA CCC and Lower US Cash Pay High Yield Index (J0A3) and ICE BofA BB US Cash Pay High Yield Index (J0A1).
<span>3. BofA Securities. Market Outlook HY Credit Strategy, 14 June 2021.
<span>4. ICE Index platform. ICE BofA US Cash Pay High Yield Index (J0A0), as of 31st May 2022.
This material is not intended to be relied upon as a forecast, research, or investment advice, and is not a recommendation, offer or solicitation to buy or sell any securities or to adopt any investment strategy. The opinions expressed by Muzinich & Co are as of June 2022
Index Descriptions
J0A0 – The ICE BofA ML US Cash Pay High Yield Index tracks the performance of US dollar denominated below investment grade corporate debt, currently in a coupon paying period that is publicly issued in the US domestic market. Qualifying securities must have a below investment grade rating (based on an average of Moody’s, S&P and Fitch), at least 18 months to final maturity at the time of issuance, at least one year remaining term to final maturity as of the rebalancing date, a fixed coupon schedule and a minimum amount outstanding of $250 million.
J0A1 – The ICE BofA ML BB US Cash Pay High Yield Index is a subset of the ICE BofA ML US Cash Pay High Yield Index (J0A0) including all securities rated BB1 through BB3, inclusive.
J0A3 – The ICE BofA ML CCC & Lower US Cash Pay High Yield Index is a subset of the ICE BofA ML US Cash Pay High Yield Index (J0A0) including all securities rated CCC1 or lower.
H4NC- H4NC – The BofA BB-B Global Non-Financial Developed Markets High Yield Constrained Index is based on securities in the The ICE BofA Global High Yield Index that have risk exposure to countries that are members of the FX-G10, Western European territories of the US and Western Europe. The FX-G10 includes all Euro members, the US, Japan, the UK, Canada, Australia, New Zealand, Switzerland, Norway and Sweden. The index includes the debt of all non-financial issuers ratedBB1 through B3, inclusive, but caps issuer exposure at 2%.
Important Information
Muzinich & Co. referenced herein is defined as Muzinich & Co., Inc. and its affiliates. This material has been produced for information purposes only and as such the views contained herein are not to be taken as investment advice. Opinions are as of date of publication and are subject to change without reference or notification to you. Past performance is not a reliable indicator of current or future results and should not be the sole factor of consideration when selecting a product or strategy. The value of investments and the income from them may fall as well as rise and is not guaranteed and investors may not get back the full amount invested. Rates of exchange may cause the value of investments to rise or fall. Emerging Markets may be more risky than more developed markets for a variety of reasons, including but not limited to, increased political, social and economic instability; heightened pricing volatility and reduced market liquidity.
Risk warnings: Alternative investments can be speculative and are not suitable for all investors. Investing in alternative investments is only intended for experienced and sophisticated investors who are willing and able to bear the high economic risks associated with such an investment. Investors should carefully review and consider potential risks before investing. Certain of these risks include: (a) Loss of all or a substantial portion of the investment;(b) Lack of liquidity in that there may be no secondary market for interests in the Fund; (c) Volatility of returns; (d) Restrictions on transferring interests; and (e) Potential lack of diversification and resulting higher risk due to concentration within one of more sectors, industries, countries or regions.
This material and the views and opinions expressed should not be construed as an offer to buy or sell or invitation to engage in any investment activity; they are for information purposes only. Opinions and statements of financial market trends that are based on market conditions constitute our judgement as at the date of this document. They are considered to be accurate at the time of writing, but no warranty of accuracy is given and no liability in respect of any error or omission is accepted. Certain information contained herein is based on data obtained from third parties and, although believed to be reliable, has not been independently verified by anyone at or affiliated with Muzinich and Co., its accuracy or completeness cannot be guaranteed. Risk management includes an effort to monitor and manage risk but does not imply low or no risk
This discussion material contains forward-looking statements, which give current expectations of the Fund’s future activities and future performance. Further, no person undertakes any duty or obligation to revise such forward-looking statements to reflect events or circumstances after the date hereof or to reflect the occurrence of unanticipated events. Muzinich makes no representation or warranty (express or implied) with respect to the information contained herein (including, without limitations, information obtained from third parties) and expressly disclaims any and all liability based on or relating to the information contained in, or errors omissions from, these materials; or based on or relating to the recipient’s use (or the use by any of its affiliates or representatives or any other person) of these materials; or based on any other written or oral communications transmitted to the recipient or any of its affiliates or representatives in the course or its evaluation of Muzinich.
United States: This material is for Institutional Investor use only – not for retail distribution. Muzinich & Co., Inc. is a registered investment adviser with the Securities and Exchange Commission (SEC). Muzinich & Co., Inc.’s being a Registered Investment Adviser with the SEC in no way shall imply a certain level of skill or training or any authorization or approval by the SEC.
Issued in the European Union by Muzinich & Co. (Ireland) Limited, which is authorized and regulated by the Central Bank of Ireland. Registered in Ireland, Company Registration No. 307511. Registered address: 32 Molesworth Street, Dublin 2, D02 Y512, Ireland. Issued in Switzerland by Muzinich & Co. (Switzerland) AG. Registered in Switzerland No. CHE-389.422.108. Registered address: Tödistrasse 5, 8002 Zurich, Switzerland. Issued in Singapore and Hong Kong by Muzinich & Co. (Singapore) Pte. Limited, which is licensed and regulated by the Monetary Authority of Singapore. Registered in Singapore No. 201624477K. Registered address: 6 Battery Road, #26-05, Singapore, 049909. Issued in all other jurisdictions (excluding the U.S.) by Muzinich & Co. Limited. which is authorized and regulated by the Financial Conduct Authority. Registered in England and Wales No. 3852444. Registered address: 8 Hanover Street, London W1S 1YQ, United Kingdom. 2022-06-21-8846