A public path to private credit: The case for BDC equities
Insight
August 4, 2025
If you have any feedback on this article or are interested in subscribing to our content, please contact us at opinions@muzinich.com or fill out the form on the right hand side of this page.
--------
Business development companies offer insurers a liquid entry point to private credit. Ji He, Lloyd Ayer and Marcus VanBerkel explore how even a modest allocation can potentially boost income and reduce correlation risk.
Private credit has emerged as a formidable force in US corporate finance, boasting nearly US$1.2 trillion in assets under management (AUM) to rival broadly syndicated loans (US$1.4 trillion) and high yield bonds (US$1.2 trillion).1
Its appeal to corporate borrowers lies in its blend of cost, execution, and flexibility. While institutional private equity limited partnerships, evergreen vehicles, and rated feeders have historically been favored ways to access private credit, we believe publicly traded business development companies (BDCs) offer an attractive, yet often overlooked, entry point for insurance investors.
These exchange-traded corporate private credit funds, classified as public equities, have historically delivered high current income (averaging a yield of over 10% in past decade, as shown in Figure 1) and the potential for principal appreciation through active management.2
For insurance companies seeking liquid, yield-enhancing alternatives to traditional equity and fixed income, BDC equities present distinct advantages, including: no capital calls or deployment curve, straightforward balance sheet treatment as equities, immediate diversification, and 100% liquidity.
Income advantage
Our analysis highlights how BDC equities can potentially bolster the investment income and diversification of non-life insurance portfolios. We constructed a peer composite of large non-life insurers, reflecting a typical asset allocation of approximately 80% fixed income, 10% public equities, and 10% alternative investments. Of the allocation to alternatives, typically split between real estate, private equity and private credit, the latter has experienced the most substantial growth within insurance portfolios recently.3
Critically, BDCs provide an efficient access point to private credit for non-life insurers, navigating common constraints like liquidity and regulatory limits, while delivering on a key objective: stable investment income.
The non-life industry's 2024 performance, marked by a 4% net investment yield, 87% operating ratio, and 10.4% pre-tax return on equity (ROE), was boosted by higher reinvestment rates since 2022.4 Yet, with the prospect of declining US rates on the horizon, finding viable options to lock in higher investment income levels for longer has become imperative.
Figure 2 demonstrates the impact of a 5% allocation to BDC equities, reallocated from the composite’s bond, equity, or mixed portfolios. In each instance, investment income and ROE experience a meaningful uplift. For example, a basic reallocation of 5% from the composite’s equity portfolio to BDC equities alone leads to a 41 basis points increase in yield without altering the overall asset allocation mix.
Figure 2: Income analysis of 5% reallocation into BDCs
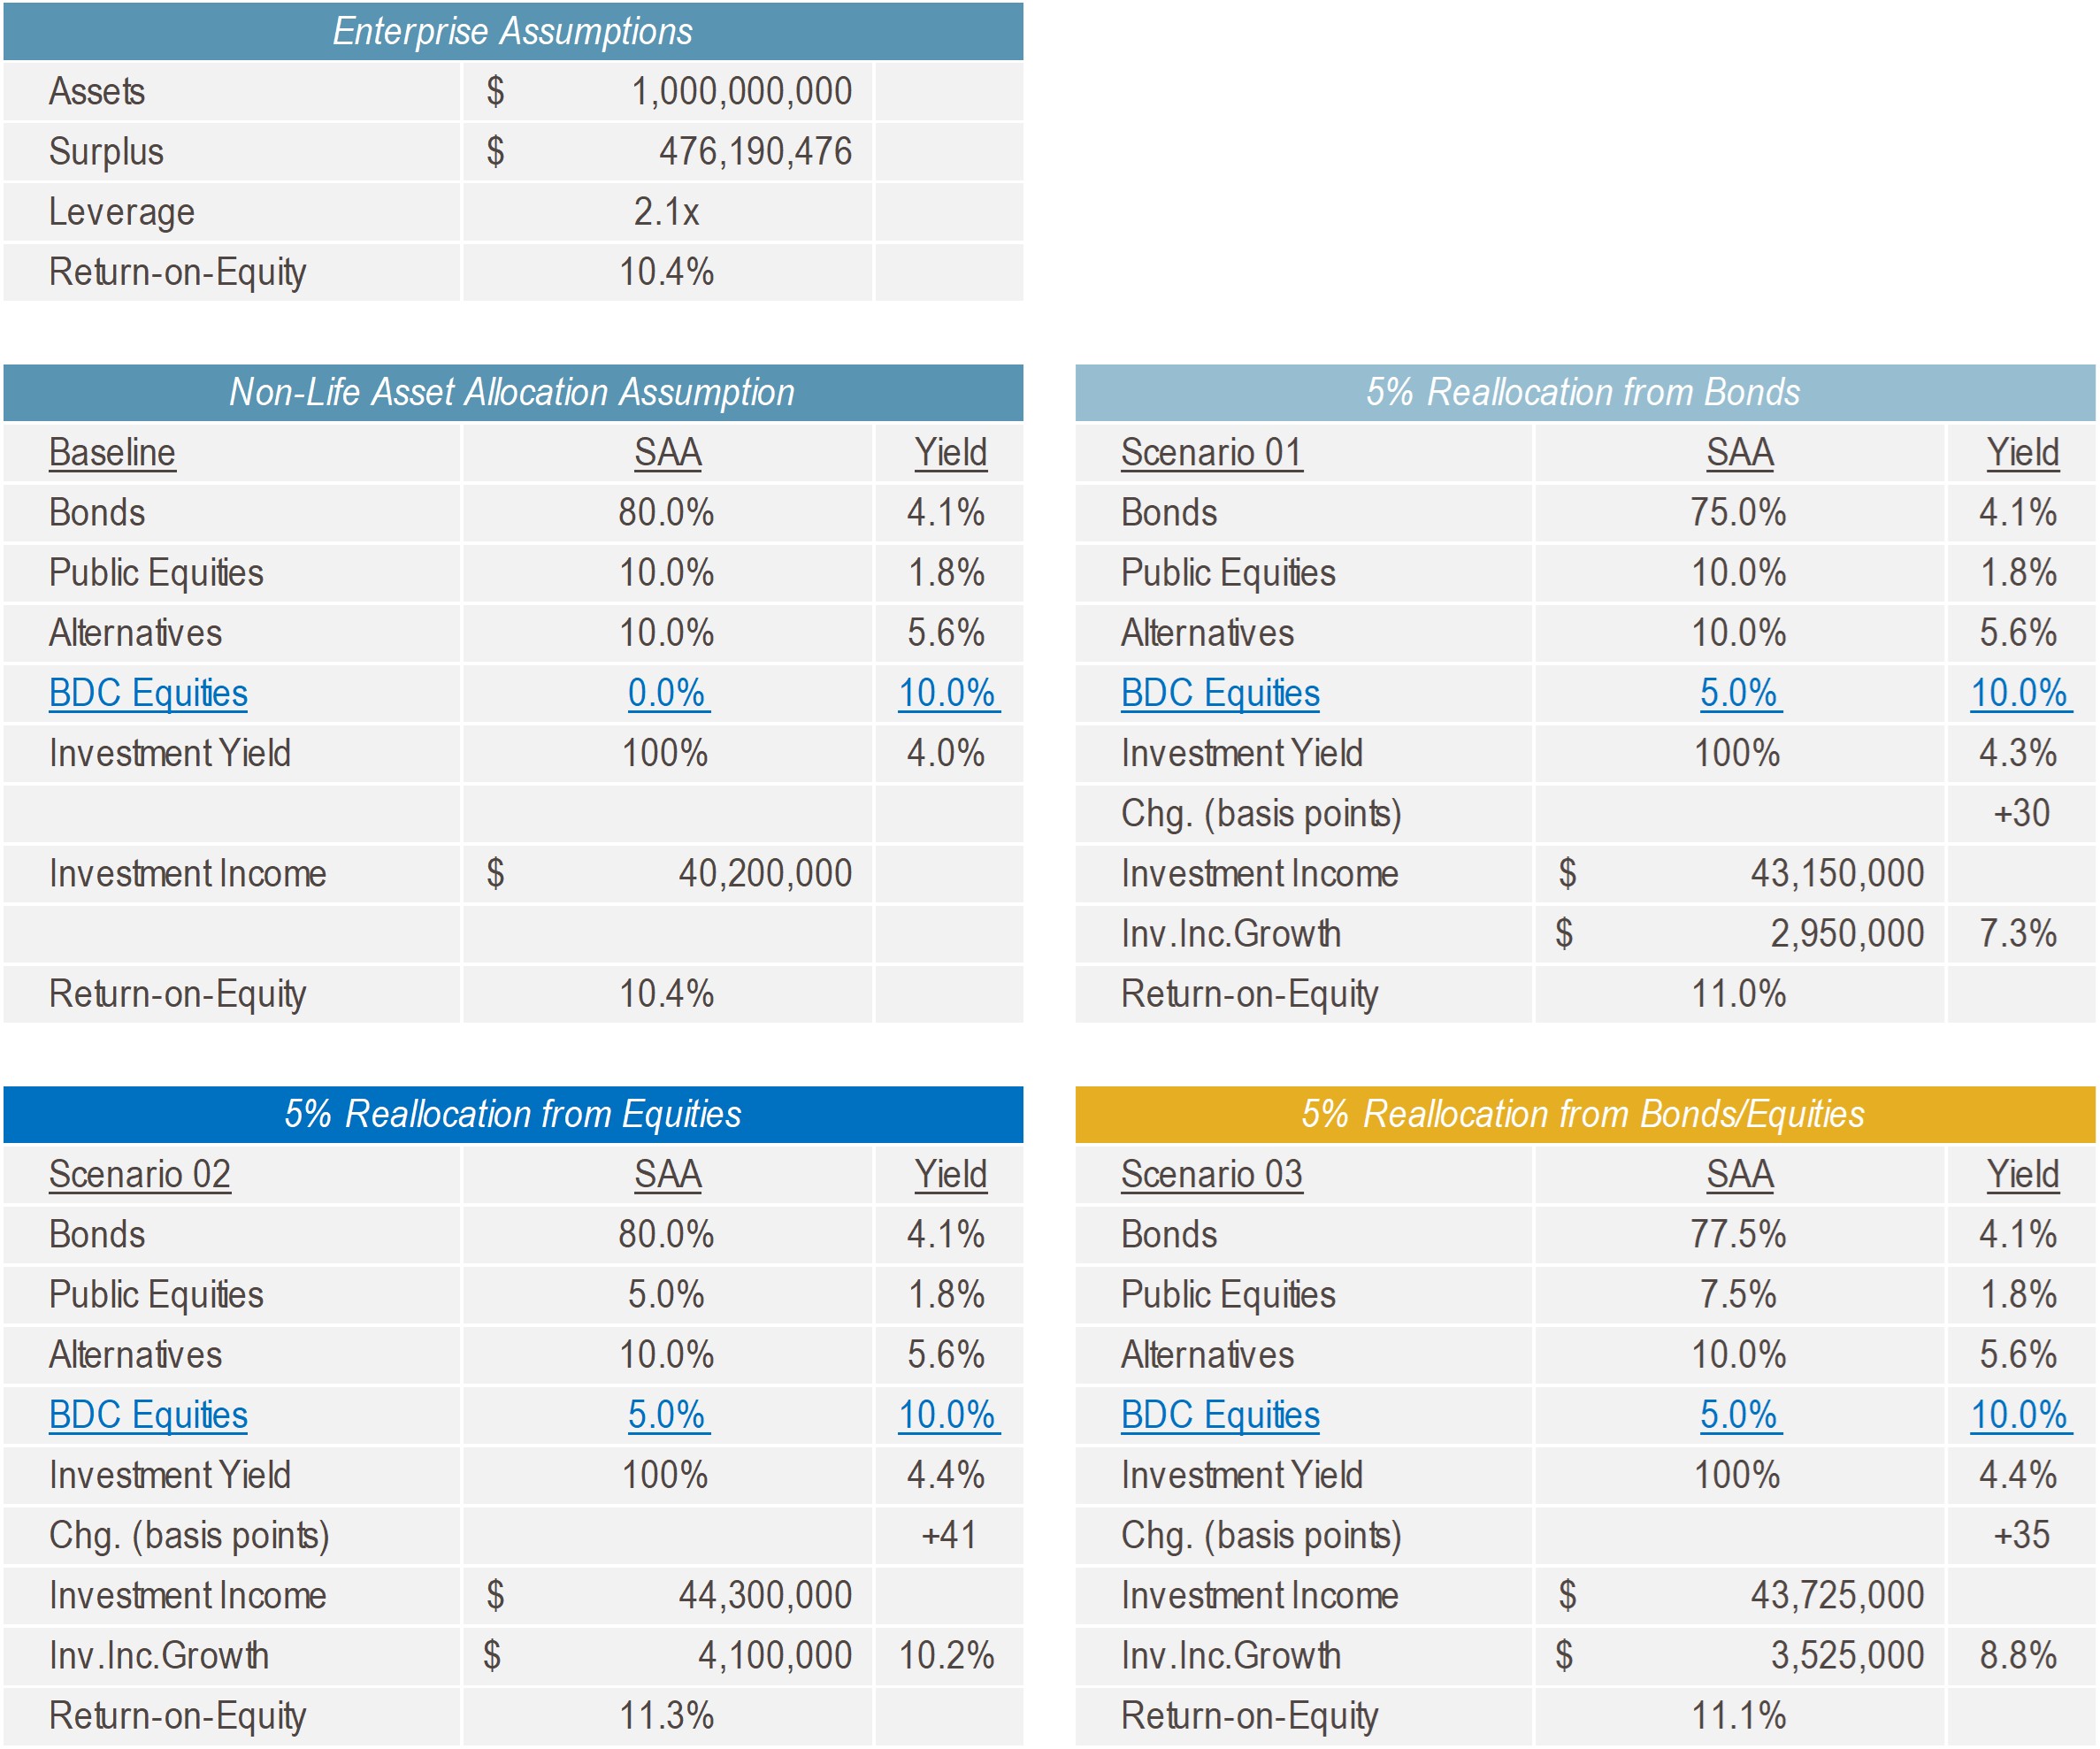
Source: Muzinich analysis, S&P Capital IQ data, as of July 2025. Based on a composite of large non-life insurers using the following objective criteria: Largest 20 US companies by invested assets, excluding state insurance funds and US subsidiaries of foreign insurers, with a CAL RBC ratio between 200 and 500. For illustrative purposes only.
Diversification edge
Inflation poses a key risk for insurance companies, threatening to erode profitability by driving up claims costs and potentially impairing bond portfolios that constitute the largest portion of their balance sheets. Given this, a primary investment objective for non-life insurers is diversification into assets that offer the potential for higher returns with a low correlation to fixed income. Traditionally, public equities have been the second-largest holding, and we believe BDC equities can play a valuable role within this allocation.
As Figure 2 illustrates, BDC equities demonstrate a correlation of 0.15 to the Aggregate Bond Index, implying a strong diversification benefit. This compares favorably to US large-cap equities, which show a correlation of 0.24. This diversification advantage holds consistently across various interest rate regimes: 0.24 vs. 0.30 in short-term rising rates, 0.26 vs. 0.40 in long-term rising rates, 0.11 vs. 0.22 in short-term falling rates, and 0.24 vs. 0.29 in long-term falling rates.
Furthermore, while BDC equities exhibit a correlation of 0.77 to US large-cap equities, this moderately high figure still offers significant efficiency due to a correlation less than 1. Crucially, there is little to no overlap in the underlying companies or equity holdings; there are currently no BDCs in the S&P 500. This further enhances their diversification potential for an insurer's overall equity exposure.
Figure 3: Public BDCs correlation versus other asset classes
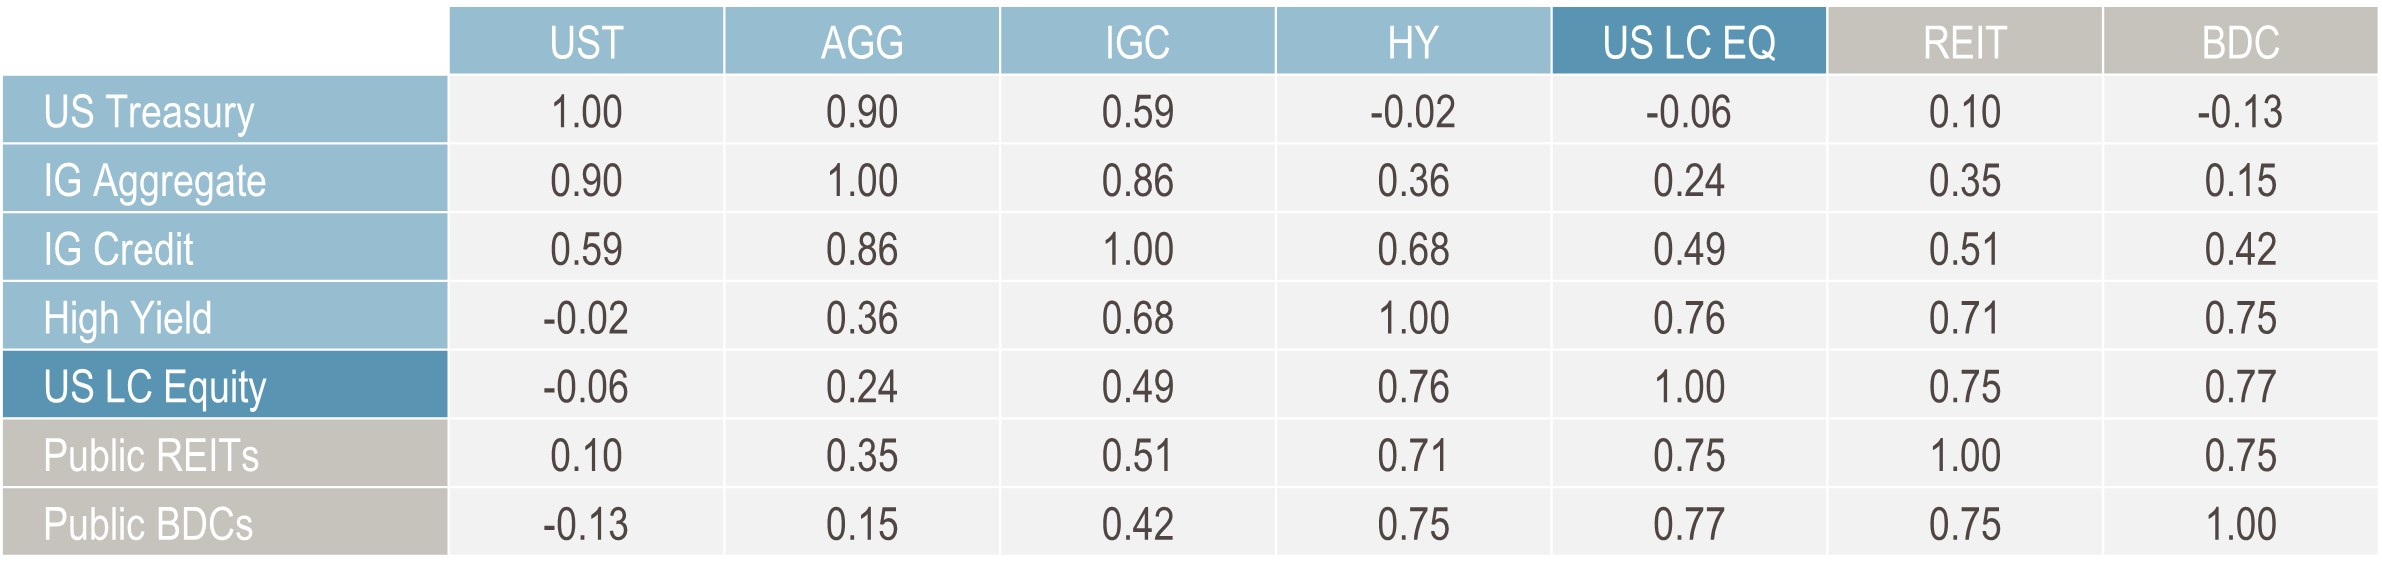 Source: Muzinich analysis, ICE Index Platform, MSCI, S&P Global, as of July 24, 2025. Ice BofA US Treasury Index (G0Q0), ICE BofA US Broad Market Index (US00), ICE BofA US Corporate Index (C0A0), ICE BofA US High Yield Index (J0A0), MSCI Russell 1000, MSCI US REIT Index, S&P BDC Index. Indices selected represent best proxy for respective asset classes. You cannot invest directly in an index, which also does not take into account trading commissions or costs. Additionally, indices do not include reinvestment of dividends and the volatility of indices may be materially different over time. For illustrative purposes only.
Volatility compression
While investment-grade fixed income typically backs insurance liabilities, the volatility of diversifying assets remains a critical consideration for surplus stability, regulatory capital, and available liquidity. BDCs, similar to many single-sector strategies, exhibit higher volatility than the overall large-cap index, with a 20-year volatility of 24.7% versus 15.4% for US large-cap equities.5
However, BDC volatility is undergoing significant compression as the sector matures. This trend is driven by two key factors: substantial growth in the number and size of public BDCs alongside growing investor understanding of companies and strategies.
Over the past decade, the asset class has grown from US$33 billion held by 45 BDCs to US$84billion held by 51 BDCs.6 During this period, BDCs have expanded their investment universe to include larger-scale companies and achieve greater portfolio diversification, which in our view has contributed to lower asset volatility. Over 20-year, 10-year, and 3-year horizons, we observe a clear pattern, with BDC equity volatility compressing from 24.7% to 21.5% to 17.0%. In contrast, over these same periods, US large-cap equity volatility has increased from 15.4% to 15.6% to 17.7%. By way of comparison, public REIT volatility has not experienced the same magnitude of compression (-1.9% vs. -7.7% for BDCs).
Further evidence of volatility compression is apparent when examining periods of significant equity market stress, including the Global Financial Crisis (GFC), COVID-19 pandemic in 2020 and interest rate spike in 2022.
During the GFC in 2008, BDC equities experienced a maximum drawdown of 71% and took 14 quarters to fully recover. At that time, the sector comprised only 23 public BDC equities with US$23 billion in assets under management. In 2020, BDC equities saw a drawdown of -45%, recovering within four quarters. Most notably, in 2022, BDC equities declined by 22% and also recovered within four quarters.
Across these scenarios, BDC equity drawdowns consistently became more shallow. In fact, the 2022 drawdown was less severe than that of US large-cap equities (-22% vs. -25%) and recovered to new highs in less time. This improved resilience coincided with the sector's expansion.
Figure 4: Decline in BDC volatility, 2005-2025
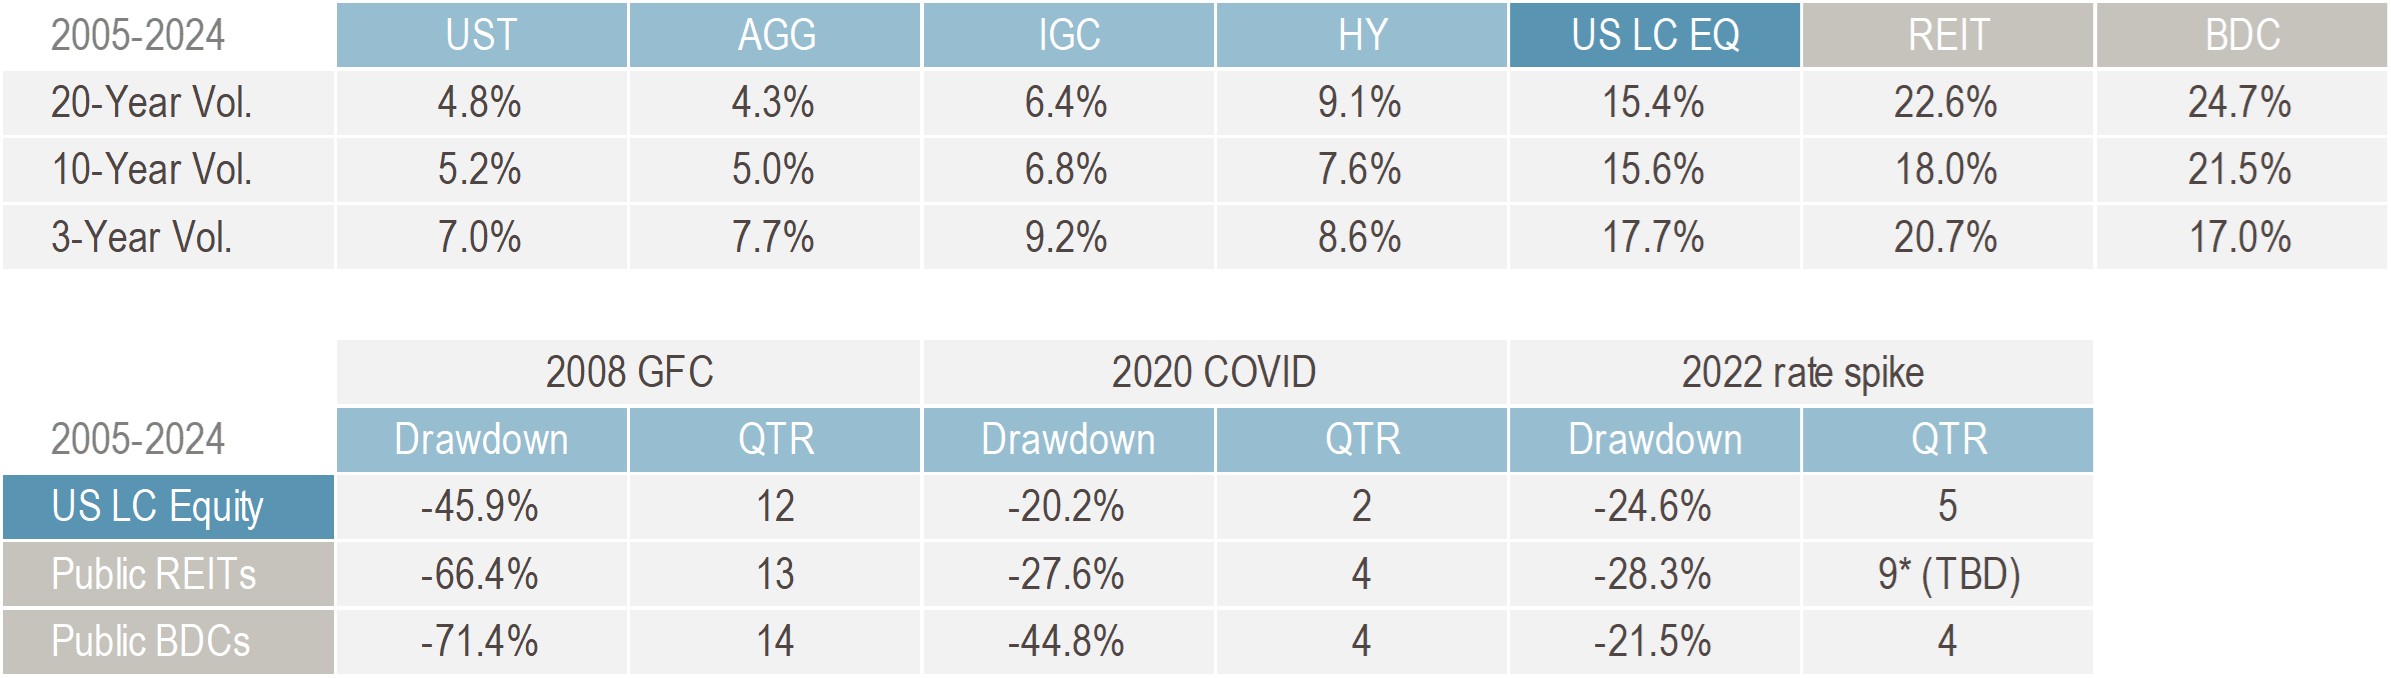
Source: Muzinich analysis, ICE Index Platform, MSCI, S&P Global, as of July 24, 2025. Ice BofA US Treasury Index (G0Q0), ICE BofA US Broad Market Index (US00), ICE BofA US Corporate Index (C0A0), ICE BofA US High Yield Index (J0A0), MSCI Russell 1000, MSCI US REIT Index, S&P BDC Index. Indices selected represent best proxy for respective asset classes. You cannot invest directly in an index, which also does not take into account trading commissions or costs. Additionally, indices do not include reinvestment of dividends and the volatility of indices may be materially different over time. For illustrative purposes only.
Active approach
BDC equities offer immediate and broad portfolio diversification, on a sector and issuer basis. Unlike individual private credit vehicles, which can take time to ramp up portfolios and typically consist of 30-40 unique borrowers, BDC portfolios are already fully invested and generating income. Based on public financials, an allocation to BDC equities provides exposure to over 4,800 unique portfolio companies, significantly surpassing what any single private credit vehicle can offer.7
Despite their public nature, we believe BDC equities are best accessed through an actively managed strategy. Passive strategies generally track indices that are disproportionately weighted towards the largest companies, which may lead to concentration risk or exposure to sub-optimal performers. Some of these larger, longer-standing entities can trade at persistent discounts due to elevated non-accruals and defaults, issues that institutional investors typically try to avoid.
Further highlighting the need for active selection, there has been significant dispersion in performance among BDCs. For example, in 2024, the best-performing BDC delivered a 58.8% return, while the worst-performing was down -68%.8
Moreover, not all BDCs operate the same strategy. Active management allows investors to gain diversification across market segments (upper, core, lower-middle market) and employ tactical diversification through more defensive private credit strategies, thereby enhancing downside protection.
Additionally, the vast majority of BDCs are not included in major equity indices such as the Russell 2000. This leaves them under-researched by mainstream equity analysts, which we believe can frequently result in mispricing. This dynamic can create opportunities for active managers to add value through rigorous fundamental credit and equity analysis. A robust active approach includes thoroughly evaluating underlying loan performance, net asset value trends, equity valuations, and maintaining direct dialogue with management teams.
Considerations for insurers
For insurance companies, particularly non-life insurers, an allocation to BDC equities involves several key considerations:
Final thoughts
For insurance companies navigating today’s complex investment landscape, we believe BDC equities provide a rare combination of income, diversification, and liquidity. As publicly traded vehicles, BDCs offer insurers a scalable and efficient path into a fast-growing segment of corporate finance, but without the limitations of traditional private fund structures.
Our analysis shows that even a modest allocation to BDCs can potentially enhance yield, reduce correlation to core bond holdings, and offer attractive risk-adjusted returns, particularly when utilizing an active management approach. Additionally, the maturing BDC sector has demonstrated improving volatility characteristics and resilience across market stress events, important considerations for insurers managing surplus volatility and regulatory capital.
In a world where compelling income options are becoming harder to find and where diversification is increasingly critical, we believe BDC equities deserve serious consideration as a strategic complement to insurance portfolios.
References
1.Preqin, ‘Alts in North America 2025,’ March 26, 2025
2.Muzinich analysis based on S&P BDC Index, as of December 31, 2024
3.Preqin, ‘Alts in North America 2025,’ March 26, 2025
4.S&P Capital IQ, 2024 annual statutory results, as of December 31, 2024
5.Muzinich analysis, ICE Index Platform, MSCI, S&P Global, as of July 24, 2025.
6.Muzinich analysis based on public filings and KBW research and market data, as of July 2025.
7.Muzinich analysis based on Pitchbook, S&P LCD data, as of March 30, 2025
8.Muzinich analysis based on public BDC filings, as of December 31, 2024
This material is not intended to be relied upon as a forecast, research, or investment advice, and is not a recommendation, offer or solicitation to buy or sell any securities or to adopt any investment strategy. The opinions expressed by Muzinich & Co are as of May 2025 and may change without notice.
--------
Index descriptions
G0Q0 – ICE BofA US Treasury Index tracks the performance of US dollar denominated sovereign debt publicly issued by the US government in its domestic market. Qualifying securities must have at least a year remaining term to final maturity, a fixed coupon schedule and a minimum amount outstanding of $1 billion.
US00 - ICE BofA US Broad Market Index tracks the performance of US dollar denominated investment grade debt publicly issued and settled in the US domestic market, including US Treasury, quasi-government, corporate, securitized and collateralized securities
C0A0 – ICE BofA US Corporate Index tracks the performance of US dollar denominated investment grade corporate debt publicly issued in the US domestic market. Qualifying securities must have an investment grade rating (based on an average of Moody’s, S&P and Fitch), at least a year remaining term to final maturity as of the rebalancing date, a fixed coupon schedule and a minimum amount outstanding of $250 million.
J0A0 – ICE BofA US High Yield Index tracks the performance of US dollar denominated below investment grade corporate debt, that is publicly issued in the US domestic market. Qualifying securities must have a below investment grade rating, at least a year remaining term to final maturity as of the rebalancing date. Additional sub-indices are divided by ratings BB through CCC, including J0A1/J0A2.
MSCI Russell 1000 - The Russell 1000 Index is a subset of the Russell 3000 Index that includes approximately 1,000 of the largest companies in the US equity universe. Constructed using a transparent, rules-based methodology, the Russell 1000 Index is designed to provide unbiased representation of the large cap segment of the US equity market.
MSCI US REIT Index – The MSCI US REIT index is a free float-adjusted market capitalization weighted index that consists of large and mid cap US equity Real Estate Investment Trusts (REITs). All securities in the index are classified in the Equity REITs Industry according to the Global Industry Classification Standard (GICS).
S&P BDC Index - The S&P BDC Index measures the performance of Business Development Companies that trade on major U.S. exchanges. Constituents are float-adjusted market capitalization (FMC) weighted, subject to a single constituent weight cap of 10%.
Important information
Muzinich & Co.”, “Muzinich” and/or the “Firm” referenced herein is defined as Muzinich & Co. Inc. and its affiliates. This material has been produced for information purposes only and as such the views contained herein are not to be taken as investment advice. Opinions are as of date of publication and are subject to change without reference or notification to you. Past performance is not a reliable indicator of current or future results and should not be the sole factor of consideration when selecting a product or strategy. The value of investments and the income from them may fall as well as rise and is not guaranteed and investors may not get back the full amount invested. Rates of exchange may cause the value of investments to rise or fall. Emerging Markets may be more risky than more developed markets for a variety of reasons, including but not limited to, increased political, social and economic instability, heightened pricing volatility and reduced market liquidity. Any research in this document has been obtained and may have been acted on by Muzinich for its own purpose. The results of such research are being made available for information purposes and no assurances are made as to their accuracy. Opinions and statements of financial market trends that are based on market conditions constitute our judgment and this judgment may prove to be wrong. The views and opinions expressed should not be construed as an offer to buy or sell or invitation to engage in any investment activity, they are for information purposes only. Any forward-looking information or statements expressed in the above may prove to be incorrect. In light of the significant uncertainties inherent in the forward-looking statements included herein, the inclusion of such information should not be regarded as a representation that the objectives and plans discussed herein will be achieved. Muzinich gives no undertaking that it shall update any of the information, data and opinions contained in the above.
United States: This material is for Institutional Investor use only – not for retail distribution. Muzinich & Co., Inc. is a registered investment adviser with the Securities and Exchange Commission (SEC). Muzinich & Co., Inc.’s being a Registered Investment Adviser with the SEC in no way shall imply a certain level of skill or training or any authorization or approval by the SEC.
Issued in the European Union by Muzinich & Co. (Ireland) Limited, which is authorized and regulated by the Central Bank of Ireland. Registered in Ireland, Company Registration No. 307511. Registered address: 32 Molesworth Street, Dublin 2, D02 Y512, Ireland. Issued in Switzerland by Muzinich & Co. (Switzerland) AG. Registered in Switzerland No. CHE-389.422.108. Registered address: Tödistrasse 5, 8002 Zurich, Switzerland. Issued in Singapore and Hong Kong by Muzinich & Co. (Singapore) Pte. Limited, which is licensed and regulated by the Monetary Authority of Singapore. Registered in Singapore No. 201624477K. Registered address: 6 Battery Road, #26-05, Singapore, 049909. Issued in all other jurisdictions (excluding the U.S.) by Muzinich & Co. Limited. which is authorized and regulated by the Financial Conduct Authority. Registered in England and Wales No. 3852444. Registered address: 8 Hanover Street, London W1S 1YQ, United Kingdom. 2025-07-30-16662


By clicking "Submit", I am (i) signing up to receive the Opinion Pieces from the "Opinions" page of the Muzinich & Co website, (ii) representing that the above information is true and accurate and (iii) agreeing to join the Muzinich & Co mailing list. I understand that Muzinich & Co will not add retail investors or individuals with personal email addresses to its mailing list and represent that I am not a retail investor. By providing my personal and professional information I am consenting to its use and disclosure in accordance with the Muzinich & Co. Privacy Policy. I understand that I may withdraw my consent and unsubscribe from receiving future communications by clicking "Unsubscribe" from the emails that are sent to me from Muzinich & Co.