EM monthly - Half Time
EM Monthly
July 23, 2026
If you have any feedback on this article or are interested in subscribing to our content, please contact us at opinions@muzinich.com or fill out the form on the right hand side of this page.
--------
As markets head into the second half, resilient fundamentals and supportive technicals continue to underpin emerging market credit. Warren Hyland takes stock of an eventful first six months and sets out his starting line-up for navigating the opportunities and risks for the second half of the year.
You can prepare the most detailed roadmap - building strategies on strong fundamentals, supportive technicals, attractive valuations and rigorous analysis of every trend and data point and begin the year with a clear game plan. Yet markets rarely unfold as expected. Unexpected events, shifting dynamics and emerging opportunities continually reshape the playing field. That is what makes the half-time team talk so valuable. By then, the surprises are visible, trends have been confirmed and initial assumptions tested against reality. It's the moment to reassess, adjust the strategy if needed and position for the second half with greater clarity and conviction.
The half-time score card
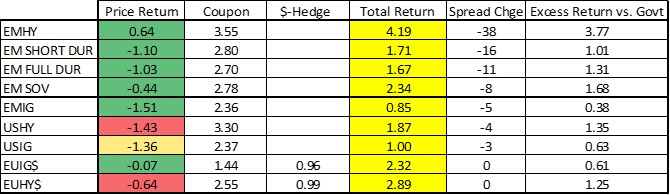
As markets enter the half-time tunnel, corporate credit is ahead of government bonds on the fixed-income scorecard., generating excess return versus its underlying government exposure. Coupon has been the strongest driver of returns and USD-denominated investors have benefited from Euro-hedged carry, although spreads did tighten for USD-denominated credit.
Emerging market (EM) credit has outperformed developed markets on a spread-tightening basis across both investment grade and high yield, with EM high yield leading credit markets on a total return basis by a significant margin. However, rising underlying government bond yields, particularly US Treasuries, partially offset the benefit of tighter spreads and limited price appreciation over the first half of the year (Figure 1).
Figure 1 – Half time total return breakdown – EM credit the outperformer
Source: ICE Index Platform and Muzinich as of 30th June 2026. EMHY. EMHB - ICE BofA High Yield Emerging Markets Corporate Plus Index EM SHORT DUR - Q690 - ICE BofA Custom Emerging Markets Short Duration Index, EM FULL DUR - EMCB - ICE BofA Emerging Markets Corporate Plus Index, EM SOV - EMGB - ICE BofA Emerging Markets External Sovereign Index, EMIG - , EMIB - ICE BofA High Grade Emerging Markets Corporate Plus Index, USHY - J0A0 - ICE BofA US Cash Pay High Yield Index, USIG - C0A0 - ICE BofA US Corporate Index, EUIG$ - ER00 – The ICE BofA Euro Corporate Index, EUHY$ - HE00 - The ICE BofA Euro High Yield Index . Index descriptions are for illustrative purposes only. You cannot invest directly in an index.
A first half full of surprises
The surprise of the first half was the onset of military operations against Iran by the US and Israel. However, the Memorandum of Understanding (MoU), subsequently signed between the US and Iran that allowed the reopening of the Strait of Hormuz,1 brought oil prices back to the levels last seen before the operation began at end February. That said, the conflict is far from over. Sporadic volatility should be expected, and damage from the supply shock to energy production has already been done.
Central banks have reversed course on monetary policy loosening, with the debate shifting from how deep the cutting cycle would go to how much room remains for further tightening. Moreover, the oil glut sloshing around global markets prior to the operation suggested prices were more likely headed toward US$50/bbl than US$70/bbl in 2026. However, the current forward curve prices Brent crude to finish the year at approximately US$72/bbl.2 With oil remaining in the US$70–80/bbl range, there's a fine balance at play: elevated energy prices have a negative effect on the global economy, pushing up inflation while constraining the cost of living and suppressing growth.
However, the Iran operation may have overshadowed a relatively strong half for politics from an investor perspective. The first notable development was the end of Fidesz-led governance under Orbán’s 16-year rule in Hungary, potentially unlocking approximately €17–18bn in suspended EU funding.3 The second was the surprise presidential victory in Colombia for right-wing outsider Abelardo de la Espriella, as Latin America continues its shift from left to right - a trend that now spans Argentina, Ecuador, Chile, Colombia and Peru.4
Meanwhile, US-China relations have reached a new, tentative stability. President Trump made his first visit to Beijing since 2017 in mid-May, and the summit delivered positive optics and stability commitments. Follow-up engagements - Xi's scheduled visit to Washington on 24 September, plus the APEC and G20 summits, could extend the détente through H2.
Finally, while the conflict in Ukraine passed a grim four-year milestone, there have been several signs, including polling shifts, softer language from Putin and continued negotiations, to suggest a ceasefire may be nearer than many think. US pressure remains the potential decisive catalyst, though unfortunately Washington's attention continues to be tied up in the Middle East.
Playing through pressure
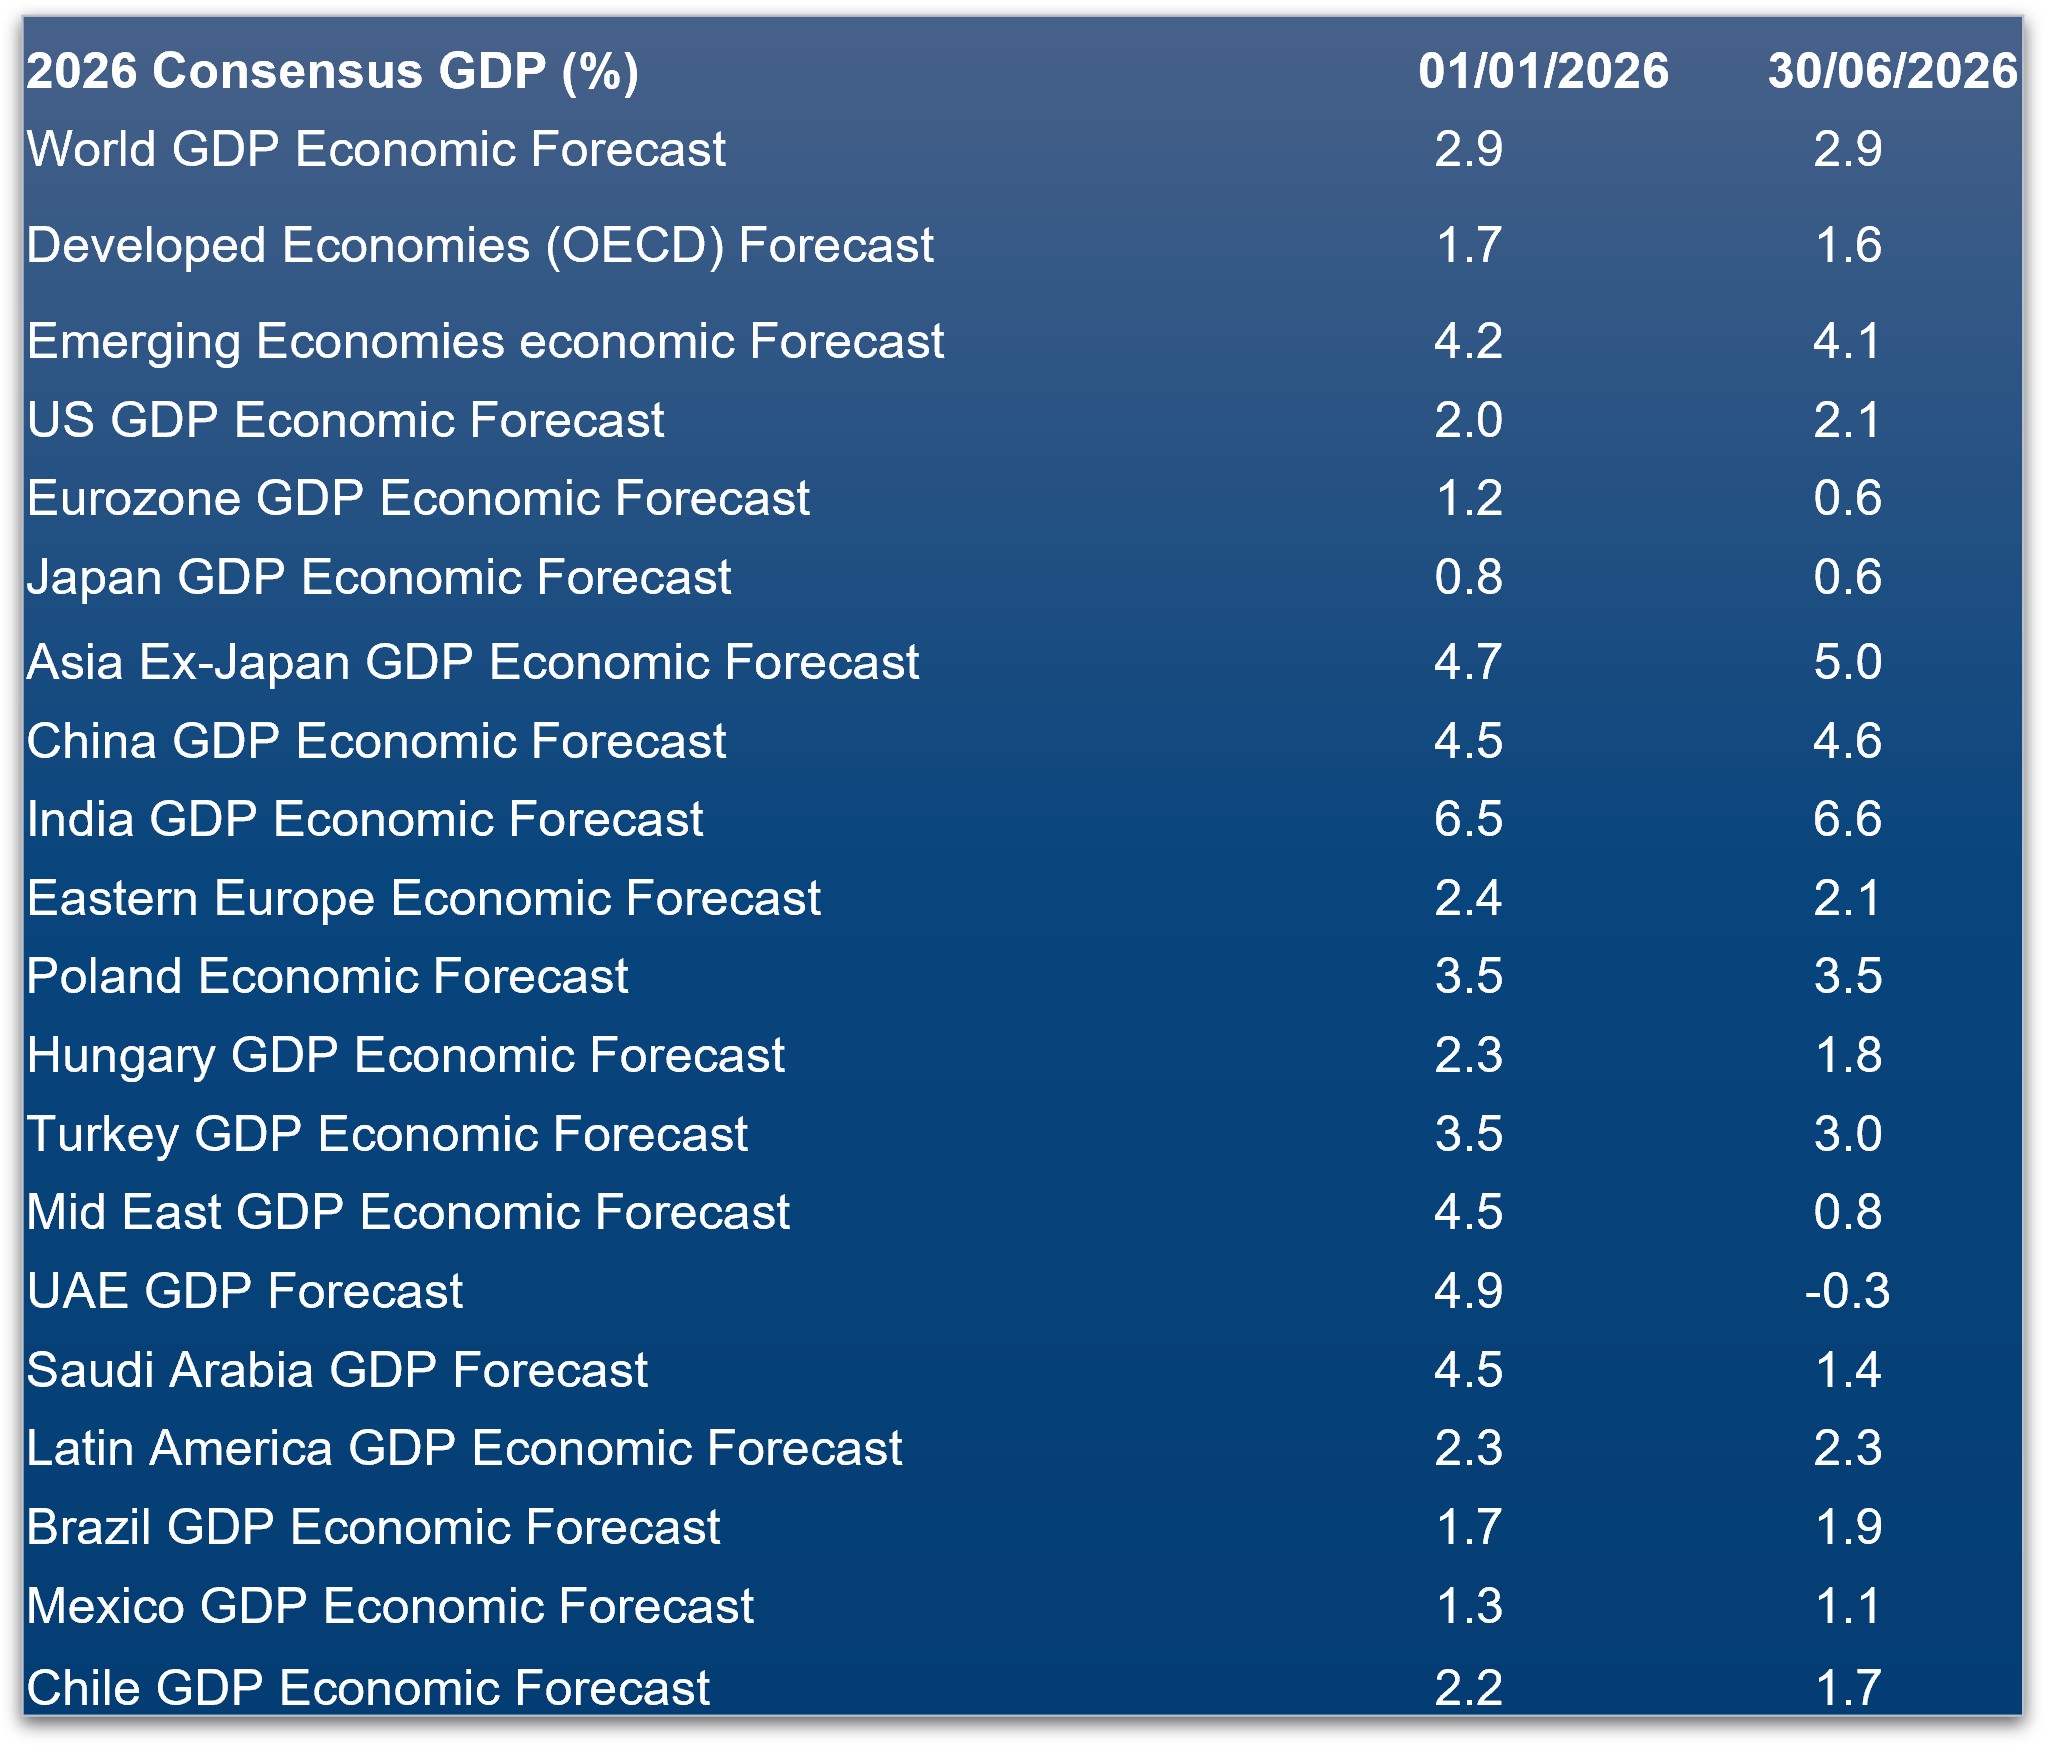
What might have surprised investors most about the first half is the resilience of global growth, given the political uncertainty and elevated energy prices. Using Bloomberg consensus as our base case, overall global growth is unchanged from start-of-year forecasts, with advanced and emerging economies each trimmed by a minimal 0.1 percentage points. Much of that resilience in advanced economies is down to the US, where growth was upgraded on the back of the AI-driven capex cycle, the sovereign’s reduced sensitivity to the energy shock as a net exporter and robust consumer spending, supported by generous tax rebates (fiscal loosening).
For emerging markets, the clear drag came from the Middle East, understandable given the roughly three-month blockade of the Strait of Hormuz. The upside surprise and regional bright spot was Asia, driven by the AI/tech export boom and a rebuilding of non-tech exports, aided by the greater certainty now that individual trade deals are in place. Asian export growth has been running near a four-year high, while India has defied the odds with growth powered by domestic demand.
China, which like the US saw a +0.1% upgrade, to 4.6% for 2026, continues to see robust manufacturing and export sectors counter weakness in property (where there are green shoots of a bottoming-out) and soft consumer sentiment. The economy expanded 5.0%YoY in Q1, buoyed by state-led infrastructure investment, resilient exports and relative insulation from the energy shock thanks to large fuel reserves.
Both the euro area and Eastern Europe are sensitive to higher energy prices, and as net importers the shock has weighed on industrial activity and consumer sentiment. A tailwind could nonetheless play out in H2 as energy prices stabilise at lower levels.
In Hungary, we expect growth to be upgraded regardless, as resumed EU funds filter into the economy following the elections and the central bank eases policy rates. Poland, meanwhile, defies the region's energy dependency, with growth powered by domestic demand, strong real wage growth, low unemployment and resilient consumption rather than external trade, a boost amplified by EU funds peaking at around 3% of GDP. Elsewhere, Türkiye should enjoy the tailwind of falling energy prices, allowing the central bank to resume gradually lowering its policy rate, although this may prove a stronger story for 2027. Israel is seeing a construction rebound, while South Africa continues to be supported by the gold and platinum group metals price cycle.
Latin America remains relatively sheltered from the energy shock and is, on balance, benefiting from firmer commodity prices. In Brazil, much will depend on how quickly the Selic can be cut from ultra-high real yields, with the administration meanwhile rolling out a series of measures to stimulate the economy and boost its popularity ahead of October's elections.
Mexico stands out as a clear casualty of US trade policy in the region, even though it should in theory be the biggest nearshoring winner. In Argentina, the positive reform story continues unabated, and further rating agency upgrades could follow toward year-end or Q1 2027. Meanwhile, the market-friendly, pro-business election result in Colombia has the potential to kick off a virtuous investment cycle.
Figure 2 - Emerging markets still expected to grow twice the spend of developed economies
Source: Bloomberg, as of 30th June 2026. For illustrative purposes only
Strong fundamentals provide the backbone
From the bottom up, we are not surprised that EM credit spreads have outperformed, and we expect this trend to continue in the second half given the supportive fundamental backdrop. Earnings momentum remains strong, with 2026 growth projected to be the highest since 2021. Growth is being led by industrials, particularly tech manufacturing and petrochemicals, and commodities, including oil and gas and metals and mining, while most other sectors are expected to deliver earnings growth of 10 to 15%, with banks remaining steady.
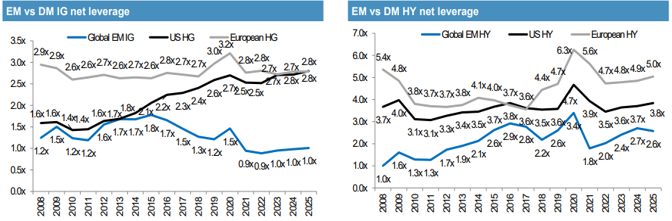
Balance sheets also remain healthy. Net leverage has declined from its recent peak and now sits below its long run average (Figure 3), reflecting limited debt accumulation, a favourable contrast to the re-leveraging currently under way in US investment grade. While the ratings trajectory has become more balanced, with upgrades and downgrades now more evenly matched after several years of net improvement, overall credit fundamentals remain very supportive.
Risk: Investment strategies, such as borrowing, increases the volatility of the portfolio and therefore the rise or fall in the value of net assets attributable will be magnified.
Figure 3: EM credit matrix best!
 Source: JP Morgan, as of June 2026. EM Corporate Strategy 2026 Mid-Year Outlook. For illustrative purposes only.
The technicals are on our side
The second reason we would suggest for EM's outperformance, and one we highlighted at the start of the year, is the very supportive technical backdrop in EM credit. We would expect these technicals to remain firmly supportive in H2, historically a lighter part of the year for issuance as companies front-load their funding.
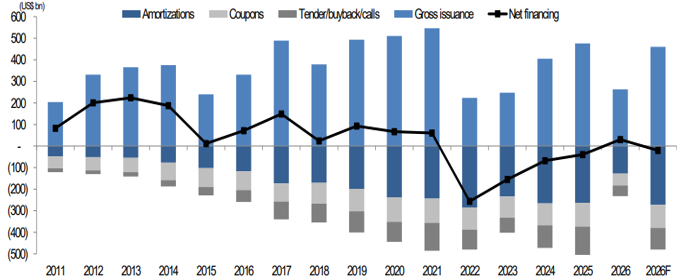
Year-to-date issuance stands at US$262bn, running slightly below projections, with investment grade accounting for 71% of supply. Net supply is contained, with gross issuance forecast at roughly US$460bn for 2026 but net financing slightly negative at around -US$20bn and moving toward balanced. Asia remains the largest contraction in net financing, at -US$19bn year-to-date and a projected shortfall of -US$63bn for 2026, as it stays cheaper for issuers to fund onshore. MEA has been the largest expansion year-to-date at US$30bn; however, we would expect that expansion to have peaked, given front-loaded funding and regional uncertainty. The other notable shrinkage has been in high yield, at -US$38bn year-to-date, where strong earnings, particularly among commodity-linked companies, and the availability of Asian onshore funding have allowed issuers to deleverage.
Figure 4: Supply becoming more balanced
Source: JP Morgan, as of June 2026. EM Corporate Strategy 2026 Mid-Year Outlook. For illustrative purposes only.
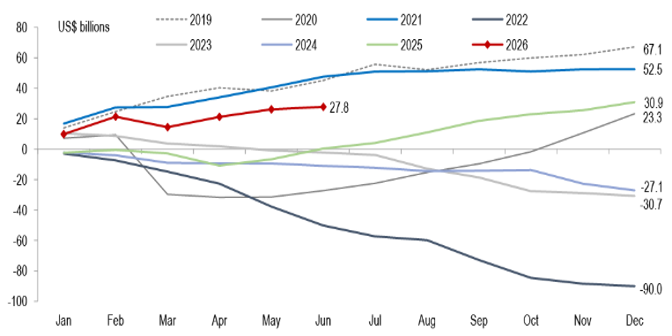
However, it's the demand side of the equation that has been the game changer. For the first time since 2021, EM fixed income has recorded a net inflow over a first half. In fact, the H1 result builds on inflows that have run consistently since the second half of 2025, and full-year inflows are expected to reach US$40–50bn in 2026. Crucially, positioning remains light across both EM-dedicated and crossover strategies. In short, light positioning, improving inflows and contained net supply add up to a technical backdrop that we believe should underpin spreads for the rest of 2026.
Figure 5: Underweight positions drive inflows
Source: : JP Morgan, as of 26th June 2026. EM Corporate Weekly Monitor. Slipping oil prices, rising World Cup fever. For illustrative purposes only.
Still value on the pitch
From a valuation standpoint, credit spreads started 2026 at the lower end of their historic range, and little has changed since.5 We expect them to remain there for the rest of the year, given the improved fundamental picture, both outright and relative to advanced economies, and the supportive technical backdrop.
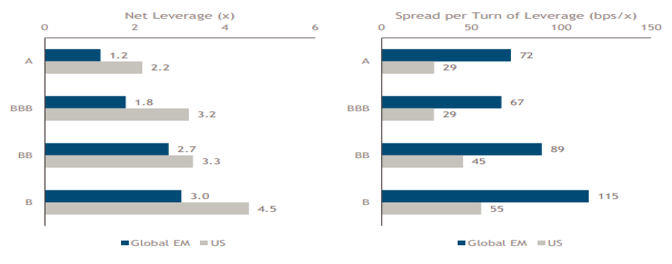
The relative case is clearest when we look at how much investors are paid per unit of leverage, leverage being the primary risk for a corporate bond investor. EM credit currently pays roughly double the premium per turn of leverage of its US counterpart in every rating bucket (Figure 6) despite EM issuers carrying less debt at each rating level. On a shorter 12-month view, EM credit sits close to fair value, with spreads across the major indices trading near the middle of the past year's range.
Figure 6: Valuations: paid double for the same risk
 Source: : Bank of America Emerging Market Chartbook, as of 30th June 2026. For illustrative purposes only.
Keeping an eye on the opposition
Games are often won or lost in the second half and, even after tweaking strategies to reflect current events, risk can still build or arrive from the unexpected. As always, EM investors need to monitor the El Niño season closely, alongside trends in credit metrics and defaults, potential spillover from private credit and an AI-driven supply shock, although the latter two look more centred on US credit.
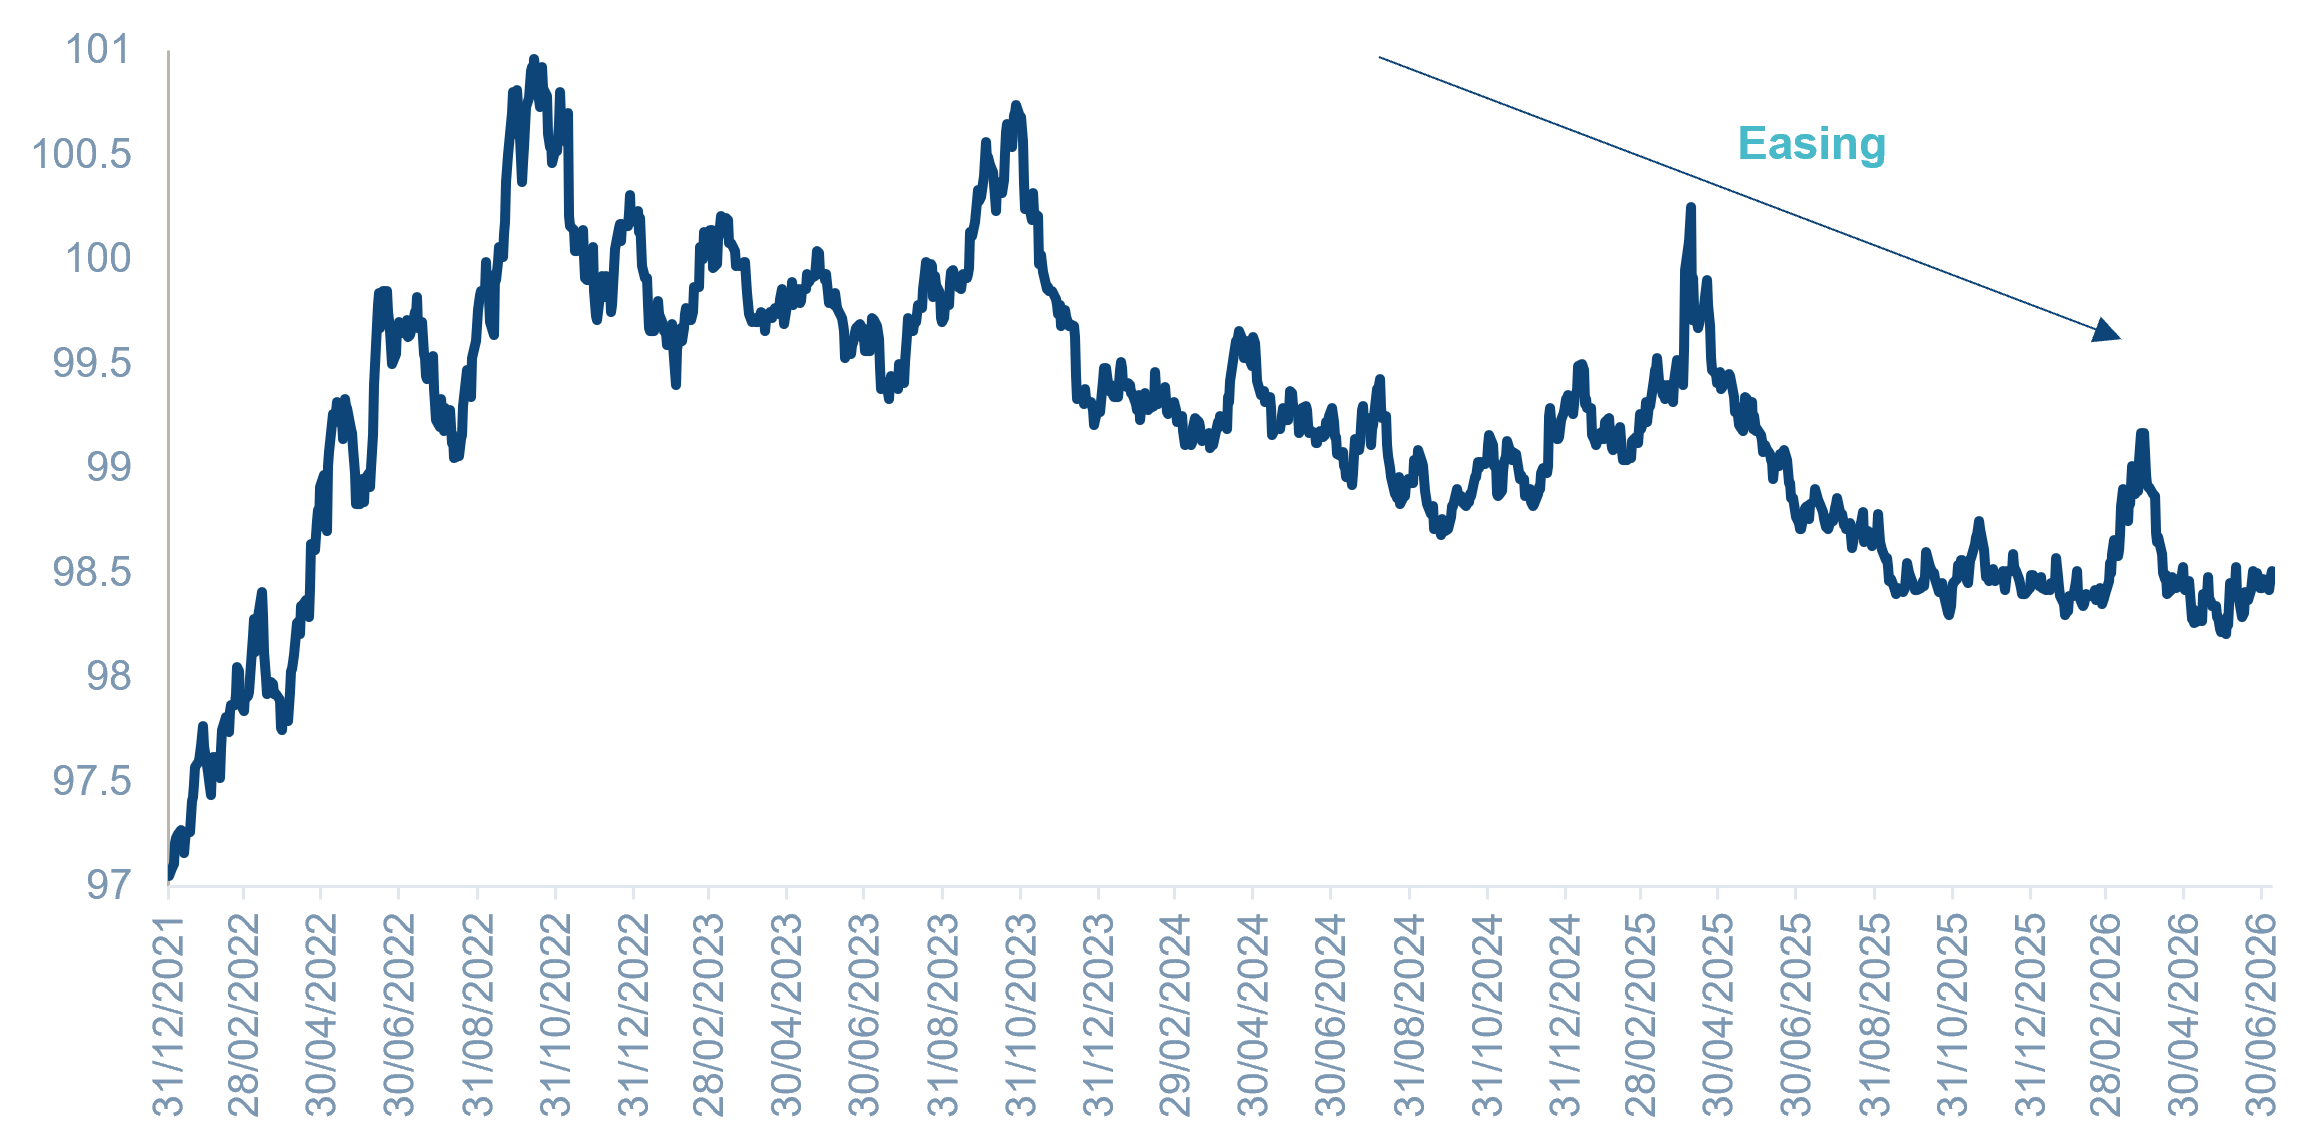
Closer to home, risks include a renewed oil shock should the Strait of Hormuz close again; using H1 as a guide, Europe would be most affected given its dependency on energy imports. The largest concern for EM, however, is the possibility that financial conditions tighten as the US Federal Reserve hikes rates to anchor inflation, and the US dollar appreciates accordingly. For this reason, the key variable to watch in the second half, as the clock ticks down, will be US financial conditions. However, as it stands, conditions remain abundantly loose, with liquidity at its most ample in five years (Figure 7).
Figure 7: US financial conditions supportive for EM
 Source: : Bloomberg; GS US financial conditions index, as of 8th July 2026. For illustrative purposes only.
The second-half game plan
Emerging market credit will continue to be underpinned by resilient global growth, robust fundamentals, light positioning and a supportive technical backdrop. It is favourable that l EM have minimal exposure to private credit or AI-capex supply spillover. Geopolitical shifts are opening new trade and investment corridors, driving supply-chain diversification and are boosting defence spending. Carry has worked and should continue to do so in the second half. With one eye on the tail risk of a hawkish Fed, we prefer carry over compression and quality over credit reach, leaving BBs as the sweet spot alongside reform stories such as Argentina, South Africa or Hungary.
The second-half line-up: themes to watch
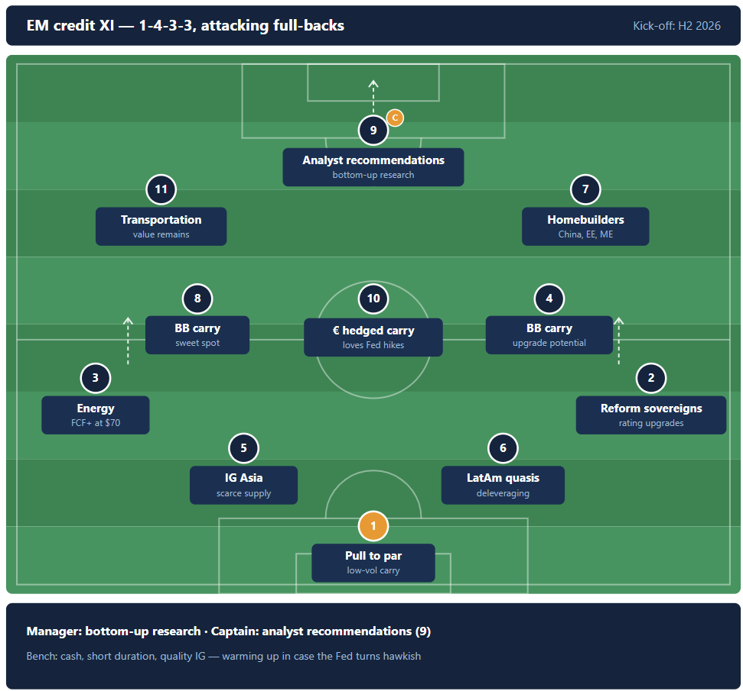
So how might the market’s starting lineup look for the second half? In goal, pull-to-par credit: bonds unaffected by shifting macro conditions, simply rolling down to maturity and collecting carry. might the market’s starting line-up look for the second half?In goal, pull-to-par credit: bonds that may be less sensitive to changing macroeconomic conditions as they roll down towards maturity and generate carry. Central defence features pairs investment grade (IG) Asia, supported by robust growth and technically scarce supply, with LatAm IG commodity quasi-sovereigns, shielded from Middle East events while benefiting from strong goods prices and ongoing deleveraging.
The attacking wing-backs are the energy sector, cash-flow positive at US$70/bbl, and a natural hedge should tail risks re-escalate in the Middle East, and reform sovereigns, where rating upgrades provide the overlap.
The central midfield is credit's sweet spot: BBs offering the best balance of carry, rate sensitivity and upgrade potential, alongside euro-hedged paper, which should keep working and work even harder if the Fed raises rates, as the hedge pick-up boosts carry and demand from dollar-based investors.
The front three to watch are transportation, which still holds value and benefits from shifting supply chains; homebuilders, with China property showing signs of bottoming; data centres and logistics build-out across Eastern Europe; and the Middle East, positioned to recover as the conflict fades. Finally, leading the line as centre-forward: themes identified through our bottom-up proprietary research.
Figure 8: Muzinich starting eleven
 Source: : Muzinich, as of July 2026. For illustrative purposes only.
EM look back – June
Past performance is not a reliable indicator of current or future results.
Market Data
Credit
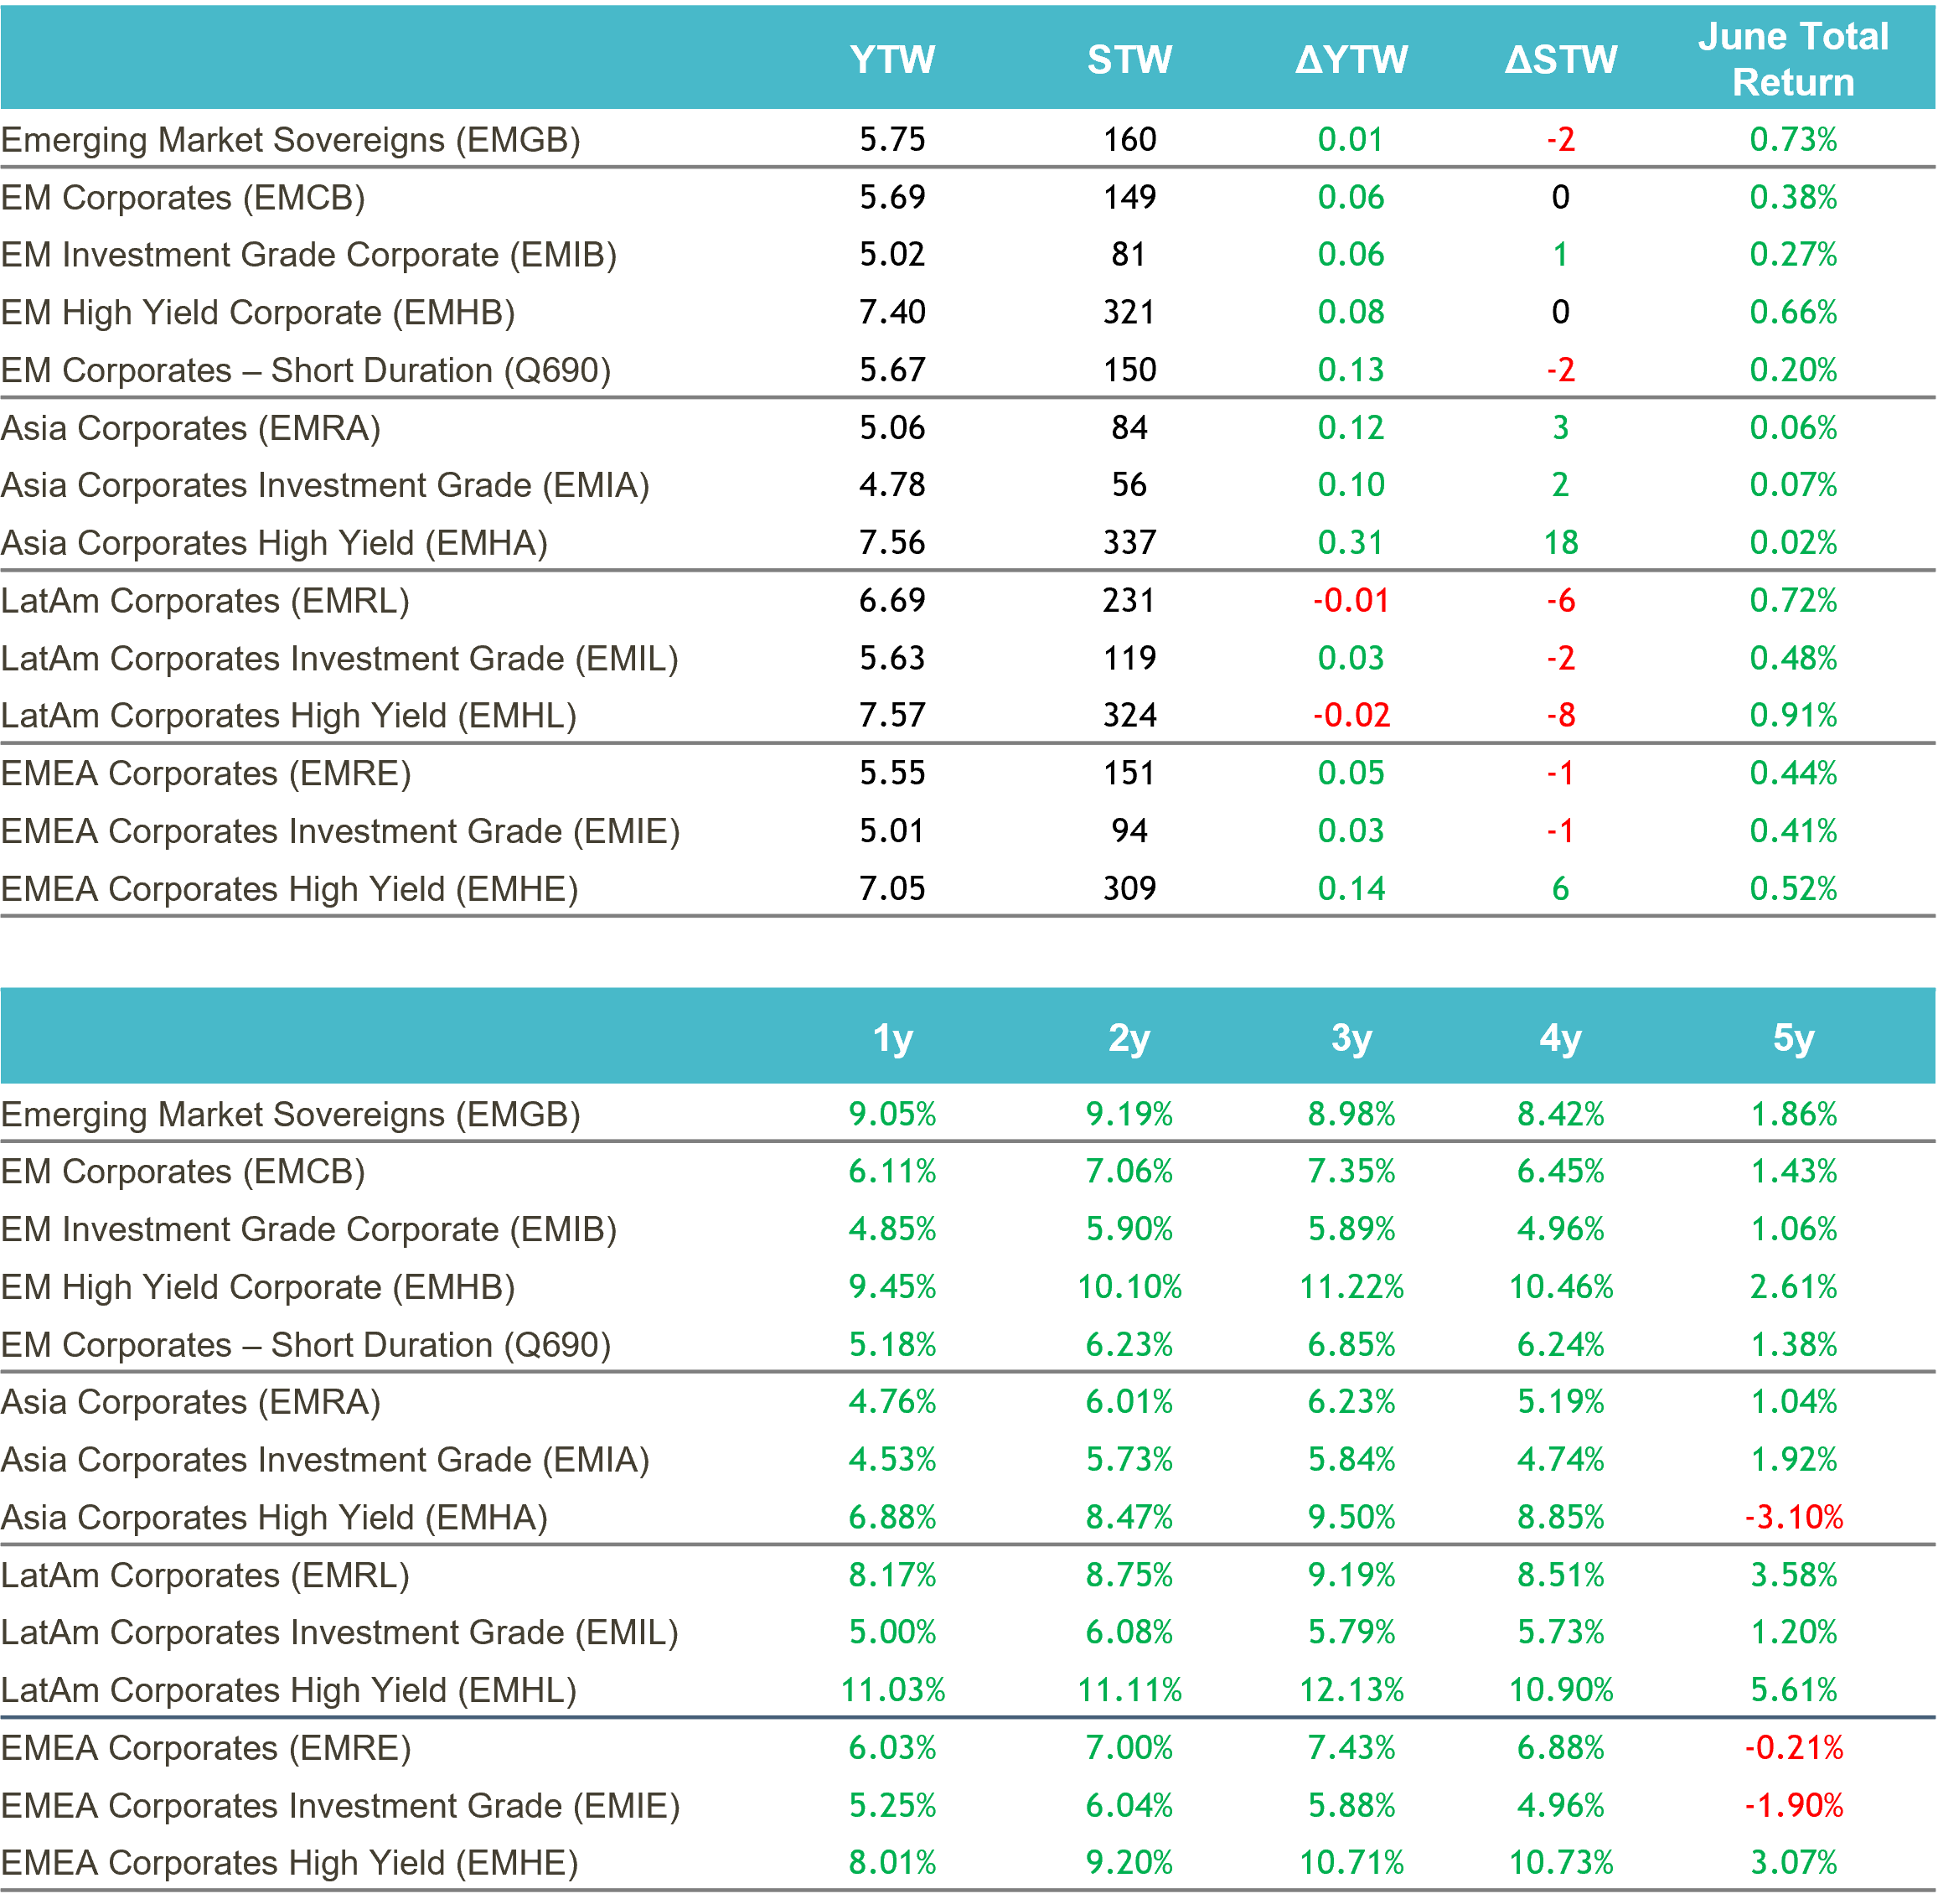
Past performance is not a reliable indicator of current or future results.
Source: ICE data platform. as of 30th June 2026. EMGB - ICE BofA Emerging Markets External Sovereign Index EMCB - ICE BofA Emerging Markets Corporate Plus Index, EMIB - ICE BofA High Grade Emerging Markets Corporate Plus Index, EMHB - ICE BofA High Yield Emerging Markets Corporate Plus Index, Q690 - ICE BofA Custom Emerging Markets Short Duration Index, EMRA - ICE BofA Asia Emerging Markets Corporate Plus Index, EMIA - ICE BofA High Grade Asia Emerging Markets Corporate Plus Index, EMHA - ICE BofA High Yield Asia Emerging Markets Corporate Plus Index , EMRL - ICE BofA Latin America Emerging Markets Corporate Plus Index, EMIL - The ICE BofA High Grade Latin America Emerging Markets Corporate Index, EMHL - ICE BofA High Yield Latin America Emerging Markets Corporate Plus, EMRE - ICE BofA EMEA Emerging Markets Corporate Plus Index, EMIE - ICE BofA High Grade EMEA Emerging Markets Corporate Plus Index, EMHE - ICE BofA High Yield EMEA Emerging Markets Corporate Plus Index,. Index performance is for illustrative purposes only. You cannot invest directly in the index. Indices selected provide best proxy for highlighting performance of emerging market corporate bonds. For illustrative purposes only.
Yield to Worst
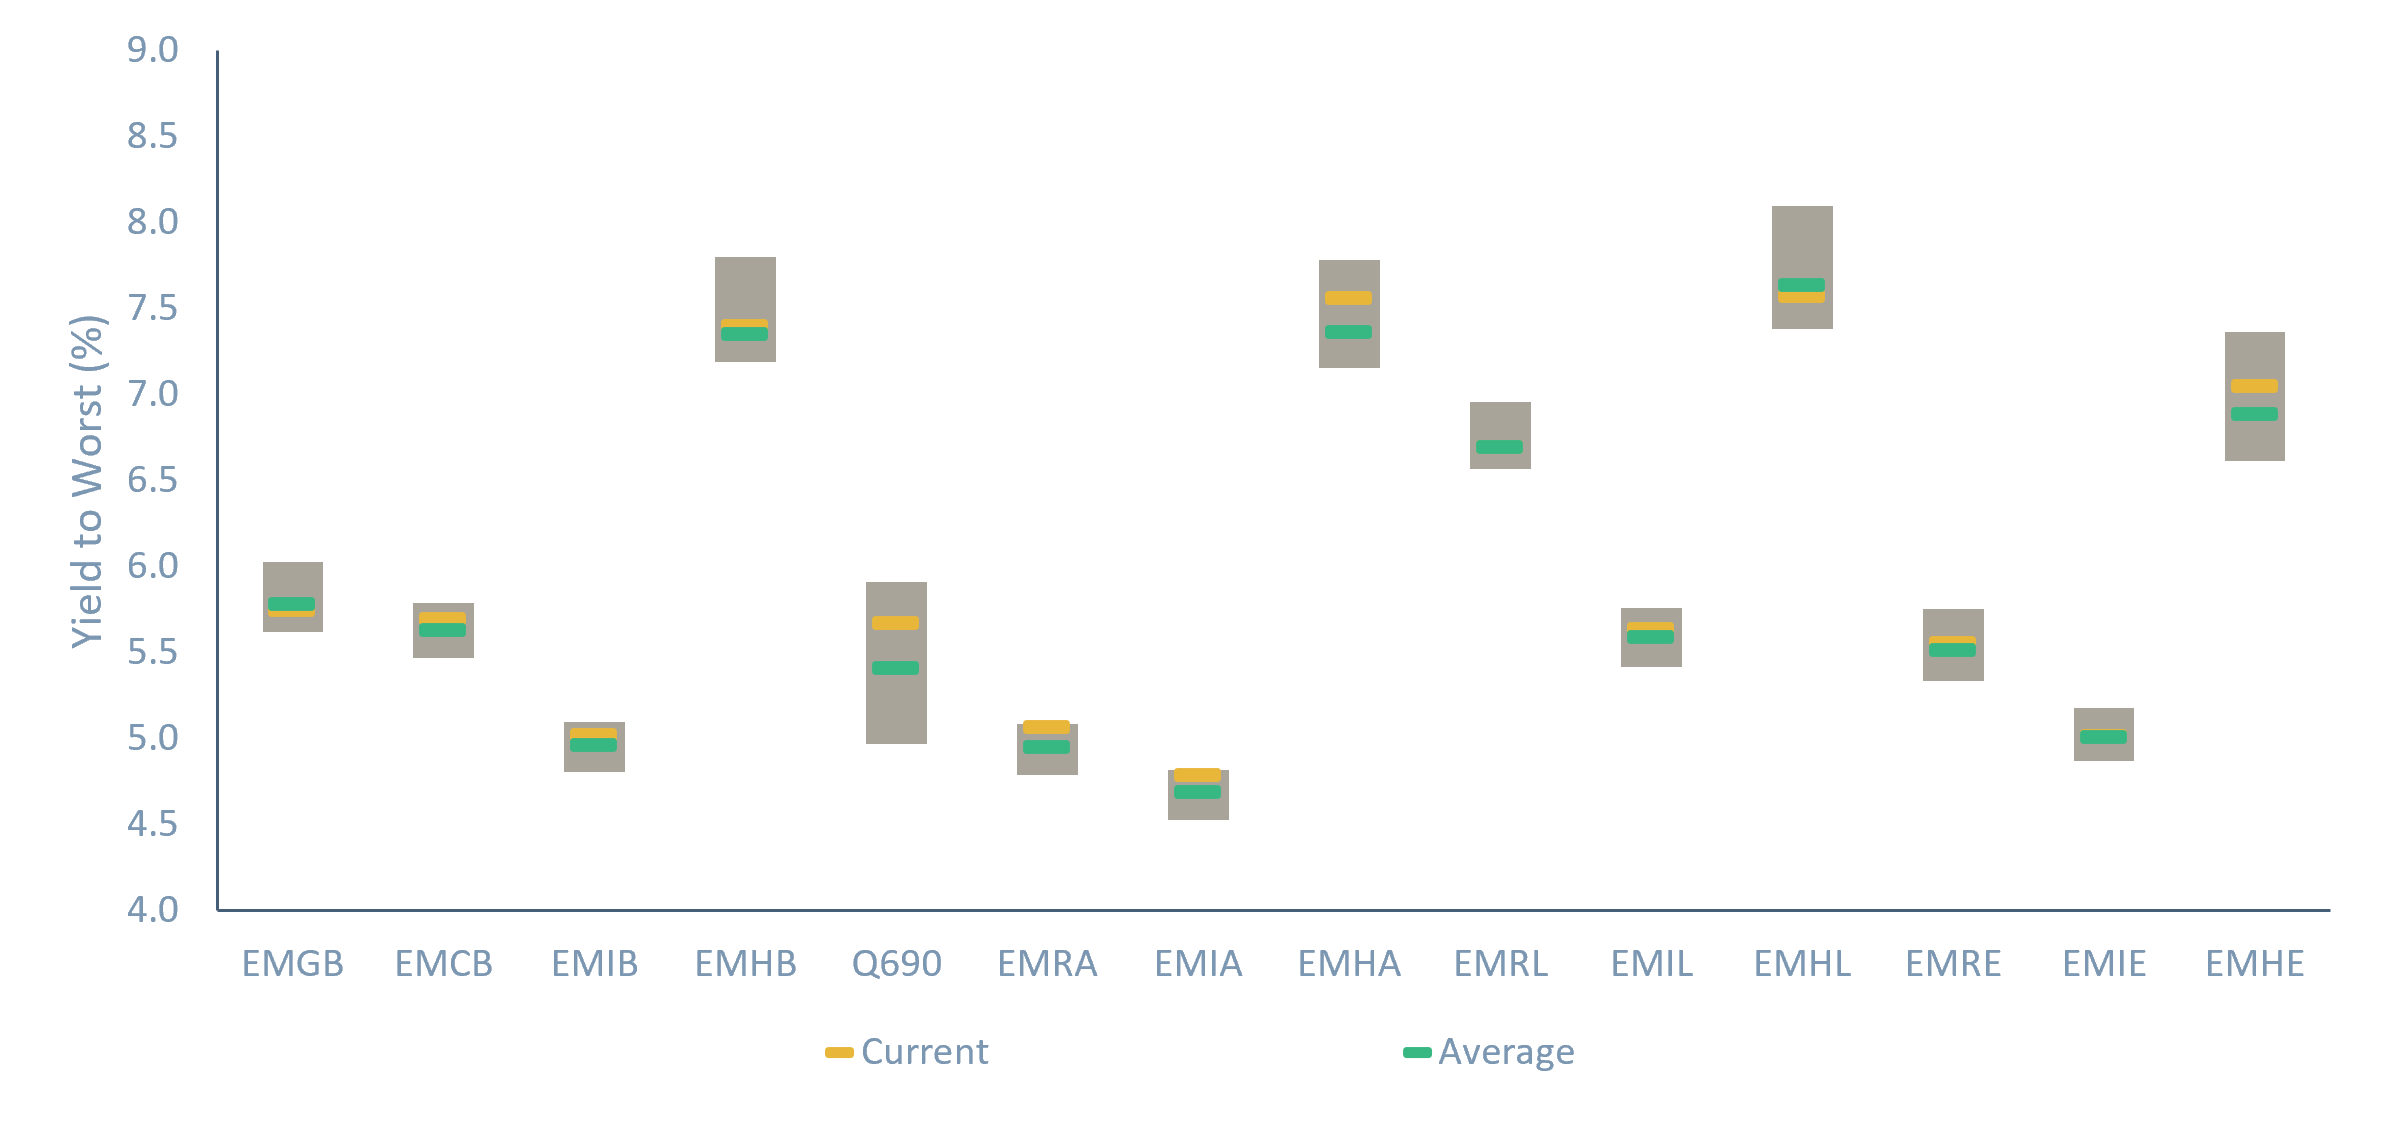 Source: ICE data platform. as of 30th June 2026. EMGB - ICE BofA Emerging Markets External Sovereign Index EMCB - ICE BofA Emerging Markets Corporate Plus Index, EMIB - ICE BofA High Grade Emerging Markets Corporate Plus Index, EMHB - ICE BofA High Yield Emerging Markets Corporate Plus Index, Q690 - ICE BofA Custom Emerging Markets Short Duration Index, EMRA - ICE BofA Asia Emerging Markets Corporate Plus Index, EMIA - ICE BofA High Grade Asia Emerging Markets Corporate Plus Index, EMHA - ICE BofA High Yield Asia Emerging Markets Corporate Plus Index , EMRL - ICE BofA Latin America Emerging Markets Corporate Plus Index, EMIL - The ICE BofA High Grade Latin America Emerging Markets Corporate Index, EMHL - ICE BofA High Yield Latin America Emerging Markets Corporate Plus, EMRE - ICE BofA EMEA Emerging Markets Corporate Plus Index, EMIE - ICE BofA High Grade EMEA Emerging Markets Corporate Plus Index, EMHE - ICE BofA High Yield EMEA Emerging Markets Corporate Plus Index,. Index performance is for illustrative purposes only. You cannot invest directly in the index. Indices selected provide best proxy for highlighting performance of emerging market corporate bonds. For illustrative purposes only.
All sources are Bloomberg unless otherwise stated.
This material is not intended to be relied upon as a forecast, research, or investment advice, and is not a recommendation, offer or solicitation to buy or sell any securities or to adopt any investment strategy. The opinions expressed by Muzinich & Co. are as of July 2026 and may change without notice.
References
1.Reuters, as of 15th June 2026. US and Iran sign ceasefire agreement, details remain uncertain.
2.ICE Index Platform, as 16th July 2026. ICE Futures Europe, Brent Crude Futures.
3.Reuters, as of 14th April 2026, “Swift work to be done”
4.Reuters, as of 21st June 2026. “Colombian right-wing candidate de la Espriella wins tight election”
5.ICE Index Platform, as of 30th June 2026. ICE BofA Emerging Market Corporate Liquid Index (EMCL)
--------
Index descriptions
EMGB - ICE BofA Emerging Markets External Sovereign Index tracks the performance of US dollar and euro denominated emerging markets sovereign debt publicly issued in the major domestic and eurobond markets. Qualifying securities must have risk exposure to countries other than members of the FX-G10, all Western European countries and territories of the US and Western European countries.
EMCB - ICE BofA Emerging Markets Corporate Plus Index tracks the performance of the US dollar and euro denominated emerging markets non-sovereign debt publicly issued in the major domestic and eurobond markets. Qualifying issuers must have risk exposure to countries other than members of the FX G10, all Western European countries, and territories of the US and Western European countries.
EMIB - ICE BofA High Grade Emerging Markets Corporate Plus Index is a subset of the ICE BofA ML Emerging Markets Corporate Plus Index (EMCB) including all securities rated AAA through BBB3, inclusive.
EMHB - ICE BofA High Yield Emerging Markets Corporate Plus Index is a subset of the ICE BofA ML Emerging Markets Corporate Plus Index (EMCB) including all securities rated BB1 or lower.
Q690 - ICE BofA Custom Emerging Markets Short Duration Index tracks the performance of short-term US dollar and euro denominated emerging markets non-sovereign debt publicly issued in the major domestic and eurobond markets.
EMRA - ICE BofA Asia Emerging Markets Corporate Plus Index is the subset of the ICE BofAML Emerging Markets Corporate Plus Index, which includes only securities issued by countries associated with the region of Asia, excluding Kazakhstan, Kyrgyzstan, Tajikistan, Turkmenistan, and Uzbekistan.
EMHA – The ICE BofA High Yield Asia Emerging Markets Corporate Plus Index is a subset of ICE BofA Emerging Markets Corporate Plus Index including all securities rated BB1 and lower with a country of risk within the Asia region.
EMIA - The ICE BofA High Grade Asia Emerging Markets Corporate Plus Index is a subset of ICE BofA Emerging Markets Corporate Plus Index including all securities rated BBB3 and higher with a country of risk within the Asia region.
EMRL - ICE BofA Latin America Emerging Markets Corporate Plus Index is a subset of The ICE BofA Emerging Markets Corporate Plus Index including all securities issued by countries associated with the geographical region of Latin America.
EMIL - The ICE BofA High Grade Latin America Emerging Markets Corporate Index is a subset of ICE BofA Emerging Markets Corporate Plus Index including all securities rated BBB3 and higher with a country of risk within the Latin America region.
EMHL - ICE BofA High Yield Latin America Emerging Markets Corporate Plus is a subset of ICE BofA Emerging Markets Corporate Plus Index including all securities rated sub-investment grade based on the average of Moody's, S&P and Fitch, and with a country of risk associated with the geographical region of Latin America.
EMRE - ICE BofA EMEA Emerging Markets Corporate Plus Index is a subset of The ICE BofA Emerging Markets Corporate Plus Index including all securities issued by countries associated with the geographical region of Europe, the Middle East and Africa including Kazakhstan, Kyrgyzstan, Tajikistan, Turkmenistan and Uzbekistan.
EMIE - ICE BofA High Grade EMEA Emerging Markets Corporate Plus Index is a subset of ICE BofA Emerging Markets Corporate Plus Index including all securities rated BBB3 and higher with a country of risk within the Europe, Middle East and Africa regions.
EMHE - ICE BofA High Yield EMEA Emerging Markets Corporate Plus Index is a subset of ICE BofA Emerging Markets Corporate Plus Index including all securities rated BBB3 and higher with a country of risk within the Europe, Middle East and Africa regions.
The MSCI EM Index is a free-float weighted equity index that captures large and mid cap representation across emerging market countries. The index covers approximately 85% of the free float-adjusted market capitalisation in each country.
LDMP - ICE BofA Local Debt Markets Plus Index is designed to track the performance of emerging markets sovereign debt publicly issued and denominated in the issuer's own currency.
J0A0 - The ICE BofA ML US Cash Pay High Yield Index tracks the performance of US dollar denominated below investment grade corporate debt, currently in a coupon paying period that is publicly issued in the US domestic market.
J0A1 – The ICE BofA BB US Cash Pay High Yield Index is a subset of the ICE BofA US Cash Pay High Yield Index (J0A0) including all securities rated BB1 through BB3, inclusive.
C0C0A0 - The ICE BofA ML US Corporate Index tracks the performance of US dollar denominated investment grade corporate debt publicly issued in the US domestic market.
HE00 - The ICE BofA ML Euro High Yield Index tracks the performance of EUR dominated below investment grade corporate debt publicly issued in the euro domestic or eurobond markets.
ER00 – The ICE BofA ML Euro Corporate Index tracks the performance of EUR denominated investment grade corporate debt publicly issued in the eurobond or Euro member domestic markets.
ICE BofA High Yield Emerging Markets Corporate Plus India Issuers Index (EINH) - is a subset of ICE BofA Emerging Markets Corporate Plus Index
ADHY - ICE BofA Asian Dollar High Yield Index tracks the performance of sub-investment grade U.S. dollar denominated sovereign, quasi-government, corporate, securitized and collateralized debt publicly issued in the U.S. domestic and eurobond markets by Asian issuers.
ICE BofA BB Asian Dollar High Yield Index (ACH1) ICE BofA BB Asian Dollar High Yield Index is a subset of ICE BofA Asian Dollar High Yield Corporate Index including all securities rated BB1 through BB3, inclusive.
ADIG - ICE BofA Asian Dollar Investment Grade Index tracks the performance of investment grade U.S. dollar denominated sovereign, quasi-government, corporate, securitized and collateralized debt publicly issued in the U.S. domestic and eurobond markets by Asian issuers. Qualifying securities have a country of risk classified as an Emerging Markets country that is part of the Asia/Pacific Region.
CEMBI Broad Div. Index - The JP Morgan CEMBI Broad Diversified Index (CEMBIB Div) is a benchmark that tracks the performance of US dollar-denominated, fixed and floating-rate debt instruments issued by emerging market corporate entities.
JESG CEMBI Broad Div. Index - The JP Morgan ESG CEMBI Broad Diversified Custom Maturity Index tracks liquid, US Dollar denominated emerging market fixed and floating-rate debt instruments issued by corporates.
EM3B – ICE BofA BB Emerging Markets Corporate Plus Index is a subset of the ICE BofA Emerging Markets Corporate Plus Index including ass securities rated BB1 through BB3, inclusive.
EMCS – ICE BofA Emerging Markets Corporate Plus Consumer Index is a subset of ICE BofA Emerging Markets Corporate Plus Index including all securities of Consumer Cyclical and Consumer Non-Cyclical issuers.
EMEN – ICE BofA Emerging Market Corporate Plus Energy Index is a subset of ICE BofA Emerging Markets Corporate Plus Index including all securities of Energy issuers.
EMRB – ICE BofA Emerging Market Corporate plus Real Estate, Building & Hotels Index is a subset of ICE BofA Emerging Markets Corporate Plus Index including all securities of Real Easte, Building & Construction, or Hotels.
EMCG – ICE BofA Emerging Markets Corporate Plus Capital Goods Index is a subset of ICE BofA Emerging Markets Corporate Plus Index including all securities of Capital Goods Issuers.
EMSD – ICE BofA Emerging Markets Diversified Corporate Index tracks the performance of USD dollar denominated emerging markets corporate senior and secured debt publicly issued in the US domestic and eurobond markets.
EMTM – ICE BofA Emerging Markets Corporate Plus Media & Telecommunications Index is a subset of ICE BofA Emerging Markets Corporate Plus index including all securities of media and telecommunications issuers.
EM2B – ICE BofA BBB Emerging Markets Corporate Plus Index is a subset of the ICE BofA Emerging Market Corporate Plus index including all securities rated BBB1 through BBB3, inclusive.
EMUT – the ICE BofA Emerging Markets Corporate Plus Utility Index is a subset of the ICE BofA Emerging Markets Corporate Plus Index including all securities of Utility issuers.
EMPB – ICE BofA Public Sector Issuers Emerging Markets Corporate Plus Index is a subset of The BofA Emerging Markets Corporate Plus Index including all quasi-government securities as well as debt of corporate issuers deemed to be government owned or controlled.
ACIG – ICE BofA Asian Dollar Investment Grade Corporate Index tracks the performance of investment grade US dollar denominated securities issued by Asian corporate issuers in the US domestic and eurobonds market. Qualyfying securities have a country of risk associated with Bangladesh, Bhutan, Cambodia, China, John Kong, India, Indonesia, Laos, Macau, Malaysia, Mongolia, Myanmar, Nepal, Pakistan, Papua New Guinea, Philippines, Singapore, South Korea, Sri Lanka, Taiwan, Thailand and Vietnam.
EMAB – Ice BofA Automotive & Basic Industry Emerging Markets Corporate Plus Index is a subset of the ICE BofA Emerging Markets Corporate Plus Index.
EMHE - The ICE BofA High Yield EMEA Emerging Markets Corporate Plus Index is a subset of ICE BofA Emerging Markets Corporate Plus Index including all securities rated BBB3 and higher with a country of risk within the Europe, Middle East and Africa regions.
EMNS – The ICE BofA Non-Financial Emerging Markets Corporate Plus Index is a subset of the ICE BofA Emerging Markets Corporate Plus Index excluding all financial securities as well as debt of corporate issuers designated as government owned or controlled by ICE BofA emerging markets credit research.
EM1B – the ICE BofA AAA-A Emerging Markets Corporate Plus Index is a subset of the ICE BofA Emerging Market Corporate Plus Index including all securities rated AAA through A3, inclusive.
including all securities with India as the country of risk that are rated sub-investment grade based on average of Moody's, S&P and Fitch
ADOL -The ICE BofA Asian Dollar Index tracks the performance of U.S. dollar denominated sovereign, quasi-government, corporate, securitized and collateralized debt publicly issued in the U.S. domestic and eurobond markets by Asian issuers.
ICE BofA China Corporate Index (CN0C) ICE BofA China Corporate Index tracks the performance of CNY denominated corporate debt issued in the Chinese domestic bond market. Qualifying securities must have at least one year remaining term to final maturity, at least 18 months to final maturity at point of issuance, a fixed coupon schedule and a minimum amount outstanding of CNY 500 million. Callable perpetual securities qualify provided they are at least one year from the first call date. Fixed-to-floating rate securities also qualify provided they are callable within the fixed rate period and are at least one year from the last call prior to the date the bond transitions from a fixed to a floating rate security. Contingent capital securities (“cocos”) are excluded, but capital securities where conversion can be mandated by a regulatory authority, but which have no specified trigger, are included. Other hybrid capital securities, such as those issues that potentially convert into preference shares, those with both cumulative and non-cumulative coupon deferral provisions, and those with alternative coupon satisfaction mechanisms, are also included in the index. Securities in legal default are excluded from the Index.
ICE BofA Investment Grade Emerging Markets Corporate Plus China Issuers Index (ECNI) ICE BofA Investment Grade Emerging Markets Corporate Plus China Issuers Index is a subset of ICE BofA Emerging Markets Corporate Plus Index including all securities with China as the country of risk that are rated investment grade based on average of Moody's, S&P and Fitch. EMFN – EM Corporate Plus Financial is a subset of ICE BofA Emerging Markets Corporate Plus Index including all securities of financial issuers.
EMIE - The ICE BofA High Grade EMEA Emerging Markets Corporate Plus Index is a subset of ICE BofA Emerging Markets Corporate Plus Index including all securities rated BBB3 and higher with a country of risk within the Europe, Middle East and Africa regions.
EM4B – ICE BofA B & Lower Emerging Markets Corporate Plus Index is a subset of the ICE BofA Emerging Markets Corporate Plus Index.
EMRT – ICE BofA Emerging Markets Corporate Plus Transportation Index is a subset of ICE BofA Emerging Markets Corporate Plus Index including all securities of Transportation issuers other than airlines or railroads.
GSFCI - The Goldman Sachs Financial Conditions Index is a measure that assesses the overall financial conditions in the economy, taking into account various factors such as interest rates, credit spreads, and equity prices.
ICE BofA B Asian Dollar High Yield Index (ACH2) ICE BofA B Asian Dollar High Yield Index is a subset of ICE BofA Asian Dollar High Yield Corporate Index including all securities rated B1 through B3, inclusive.
ICE BofA Single-B US Cash Pay High Yield Index (J0A2) ICE BofA Single-B US Cash Pay High Yield Index is a subset of ICE BofA US Cash Pay High Yield Index including all securities rated B1 through B3, inclusive.
You cannot invest directly in an index, which also does not take into account trading commissions or costs. Additionally, indices do not include reinvestment of dividends, and the volatility of indices may be materially different over time.
--------
Important information
Muzinich and/or Muzinich & Co. referenced herein is defined as Muzinich & Co., Inc. and its affiliates. Muzinich views and opinions. This material has been produced for information purposes only and as such the views contained herein are not to be taken as investment advice. Opinions are as of date of publication and are subject to change without reference or notification to you. Past performance is not a reliable indicator of current or future results and should not be the sole factor of consideration when selecting a product or strategy. The value of investments and the income from them may fall as well as rise and is not guaranteed and investors may not get back the full amount invested. Rates of exchange may cause the value of investments to rise or fall.
Any research in this document has been obtained and may have been acted on by Muzinich for its own purpose. The results of such research are being made available for information purposes and no assurances are made as to their accuracy. Opinions and statements of financial market trends that are based on market conditions constitute our judgment and this judgment may prove to be wrong. The views and opinions expressed should not be construed as an offer to buy or sell or invitation to engage in any investment activity, they are for information purposes only.
This discussion material contains forward-looking statements, which give current expectations of future activities and future performance. Any or all forward-looking statements in this material may turn out to be incorrect. They can be affected by inaccurate assumptions or by known or unknown risks and uncertainties. Although the assumptions underlying the forward-looking statements contained herein are believed to be reasonable, any of the assumptions could be inaccurate and, therefore, there can be no assurances that the forward-looking statements included in this discussion material will prove to be accurate. In light of the significant uncertainties inherent in the forward-looking statements included herein, the inclusion of such information should not be regarded as a representation that the objectives and plans discussed herein will be achieved. Further, no person undertakes any obligation to revise such forward-looking statements to reflect events or circumstances after the date hereof or to reflect the occurrence of unanticipated events.
United States: This material is for Institutional Investor use only – not for retail distribution. Muzinich & Co., Inc. is a registered investment adviser with the Securities and Exchange Commission (SEC). Muzinich & Co., Inc.’s being a Registered Investment Adviser with the SEC in no way shall imply a certain level of skill or training or any authorization or approval by the SEC.
United Arab Emirates (UAE): This information is provided for discussion and informational purposes only and does not constitute an offer or solicitation in the UAE. It is intended solely for Professional Investors and should not be relied upon by any other person. This material has not been reviewed or approved by the UAE Securities and Commodities Authority, the UAE Central Bank or any other relevant authority. Nothing contained herein constitutes investment, legal, tax or other professional advice. Recipients should make their own independent assessment where appropriate.
Abu Dhabi Global Market (ADGM): This information is provided for discussion and informational purposes only and does not constitute an offer or solicitation in the ADGM. It is intended solely for Professional Clients (as defined by the Financial Services Regulatory Authority) and should not be relied upon by any other person. This material has not been reviewed or approved by the Financial Services Regulatory Authority or any other relevant authority in the UAE.
Issued in the European Union by Muzinich & Co. (Ireland) Limited, which is authorized and regulated by the Central Bank of Ireland. Registered in Ireland, Company Registration No. 307511. Registered address: 32 Molesworth Street, Dublin 2, D02 Y512, Ireland. Issued in Switzerland by Muzinich & Co. (Switzerland) AG. Registered in Switzerland No. CHE-389.422.108. Registered address: Tödistrasse 5, 8002 Zurich, Switzerland. Issued in Singapore and Hong Kong by Muzinich & Co. (Singapore) Pte. Limited, which is licensed and regulated by the Monetary Authority of Singapore. Registered in Singapore No. 201624477K. Registered address: 6 Battery Road, #26-05, Singapore, 049909. Issued in all other jurisdictions (excluding the U.S.) by Muzinich & Co. Limited. which is authorized and regulated by the Financial Conduct Authority. Registered in England and Wales No. 3852444. Registered address: 8 Hanover Street, London W1S 1YQ, United Kingdom. 2026-07-17-19016

Key takeaways
By clicking "Submit", I am (i) signing up to receive the Opinion Pieces from the "Opinions" page of the Muzinich & Co website, (ii) representing that the above information is true and accurate and (iii) agreeing to join the Muzinich & Co mailing list. I understand that Muzinich & Co will not add retail investors or individuals with personal email addresses to its mailing list and represent that I am not a retail investor. By providing my personal and professional information I am consenting to its use and disclosure in accordance with the Muzinich & Co. Privacy Policy. I understand that I may withdraw my consent and unsubscribe from receiving future communications by clicking "Unsubscribe" from the emails that are sent to me from Muzinich & Co.

Sep 07, 2026
Asia Credit: An underappreciated opportunity
Asia credit combines the growth potential of emerging markets with the quality characteristics of developed markets. Supported by resilient fundamentals, favourable technicals and powerful structural trends, the asset class offers a compelling opportunity for investors seeking diversification, income and long-term capital preservation explains Mel Siew.

Jul 30, 2026
Emerging Markets: The Half-Time Team Talk
What does a football half-time team talk have in common with emerging market credit? In our latest Muzinich Podcast, Warren Hyland, Head of Emerging Markets, uses the football-inspired framework from his latest Emerging Markets Monthly, Half Time, to reflect on the first six months of the year and discuss the outlook for the remainder of 2026.

Jun 12, 2026
EM monthly - The politics of credit
Political headlines can be noisy, but institutional strength remains one of the most important drivers of sovereign creditworthiness. From Hungary and Colombia to Romania and Indonesia, political developments in 2026 are reshaping investment opportunities across emerging markets, with implications not only for sovereign bonds but also for the corporate issuers operating within them argues Warren Hyland.