Finding value without reaching for yield
Insight
July 15, 2026
If you have any feedback on this article or are interested in subscribing to our content, please contact us at opinions@muzinich.com or fill out the form on the right hand side of this page.
--------
Tight spreads often push investors to reach for yield in lower-quality credit. We think more durable opportunities lie elsewhere – pull-to-par, carry earned without taking on distressed credit risk and seeking out good businesses with good balance sheets that are trading cheap because of temporary disruption.
Earning the income of the high yield market without sacrificing credit quality
With spreads back near the tight end of their historical range, the market's reflex is familiar: if yields are attractive but generic BB/B carry feels expensive, reach further down in quality to find more. We think that instinct is exactly backwards in this environment. To the extent we do own CCC risk, we focus on names we believe are mis-rated relative to their actual credit quality rather than genuinely distressed issuers with weak balance sheets – and overall we continue to run our portfolios with meaningfully less CCC exposure than the broader index.
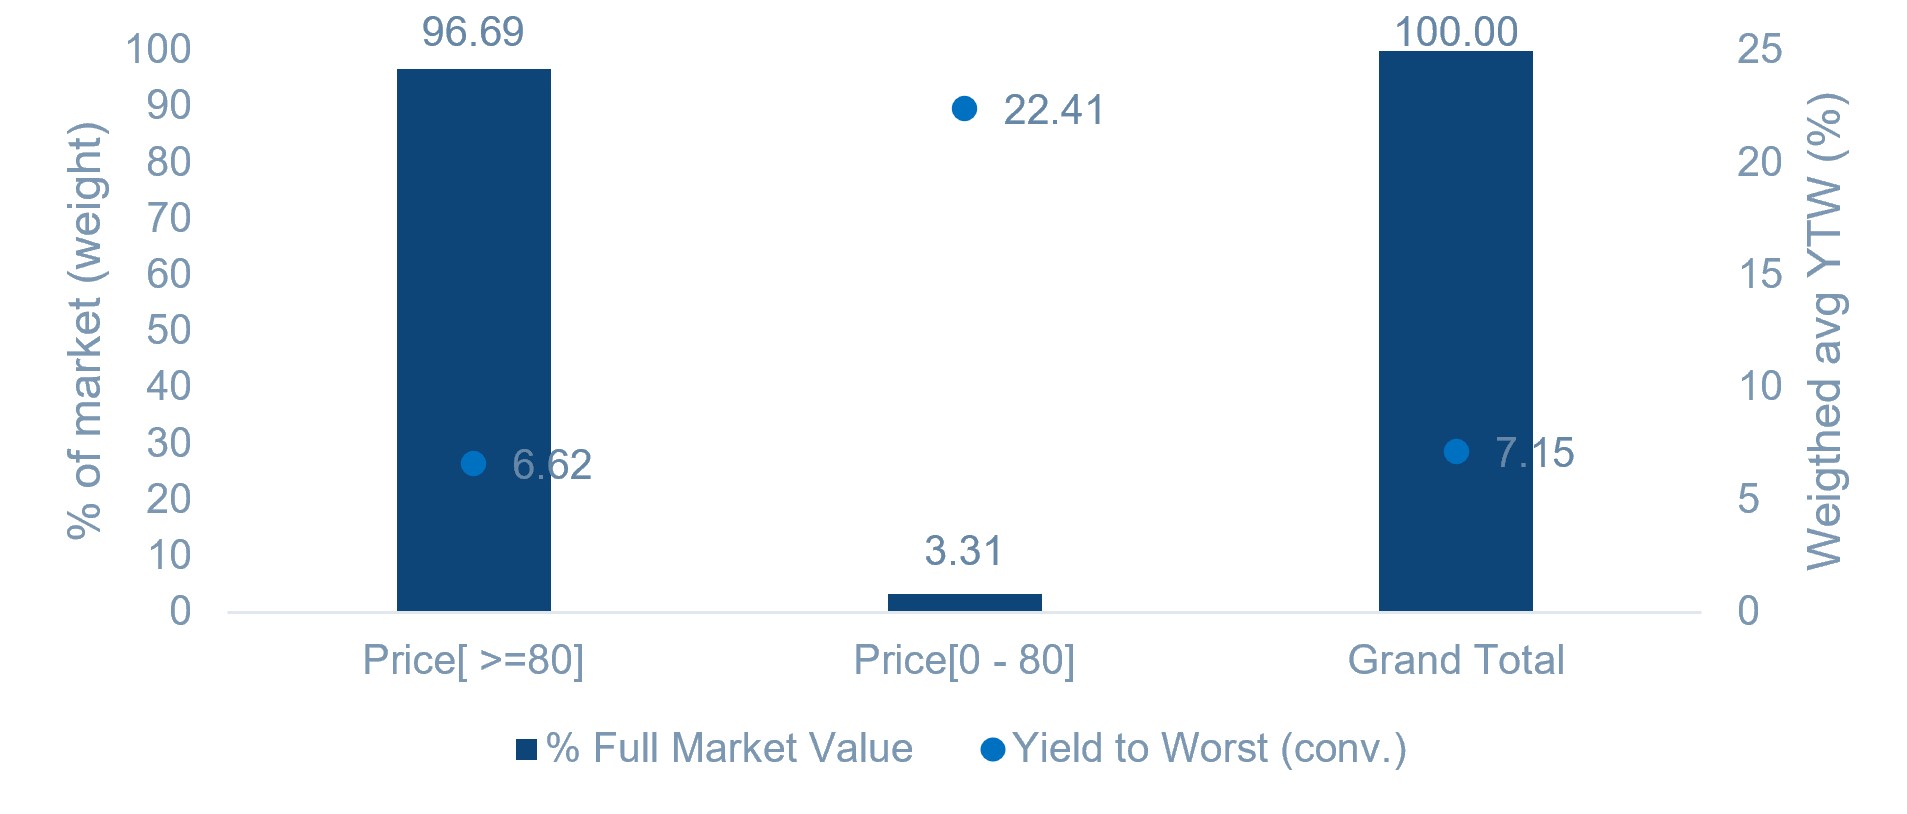
In fact, when excluding stressed bonds trading below 80 cents, the yield on the full market high yield index (H0A0 of which 10% of issuers are CCC rated) drops from 7.1% to 6.5%,1 despite the fact that bonds trading below US$80 (a level typically indicating credit stress) only account for 3.4% of the H0A0 index; 6.5% is the approximate yield on our market duration US high yield strategy, matching the yield of the market’s performing issuers while carry less overall credit risk.
We think of the yield difference between H0A0 and the strategy as phantom yield because the probability of stressed issuers making coupon payments is considerably lower than most issuers in the market. This theme is illustrated by the difference between the year-to-date return on the H0A0 and the B/BB Index (JUC4) . At 12/31/25 H0A0’s yield-to-worst was 6.62% while JUC4’s yield-to-worst was 5.98%. However, year to date (to 30th June 2026) JUC4 has returned more than 2%, while H0A0 has returned 1.9%, despite the fact that H0A0’s yield started the year more than 60 basis points higher than JUC4.
Figure 1 – High yield index: market weight and yield by price segment
Source: ICE Index Platform, as of 8th July 2026. ICE BofA US High Yield Index (H0A0). Index performance is for illustrative purposes only. You cannot invest directly in an index.
Pull-to-par as a return driver, not just a defensive stance
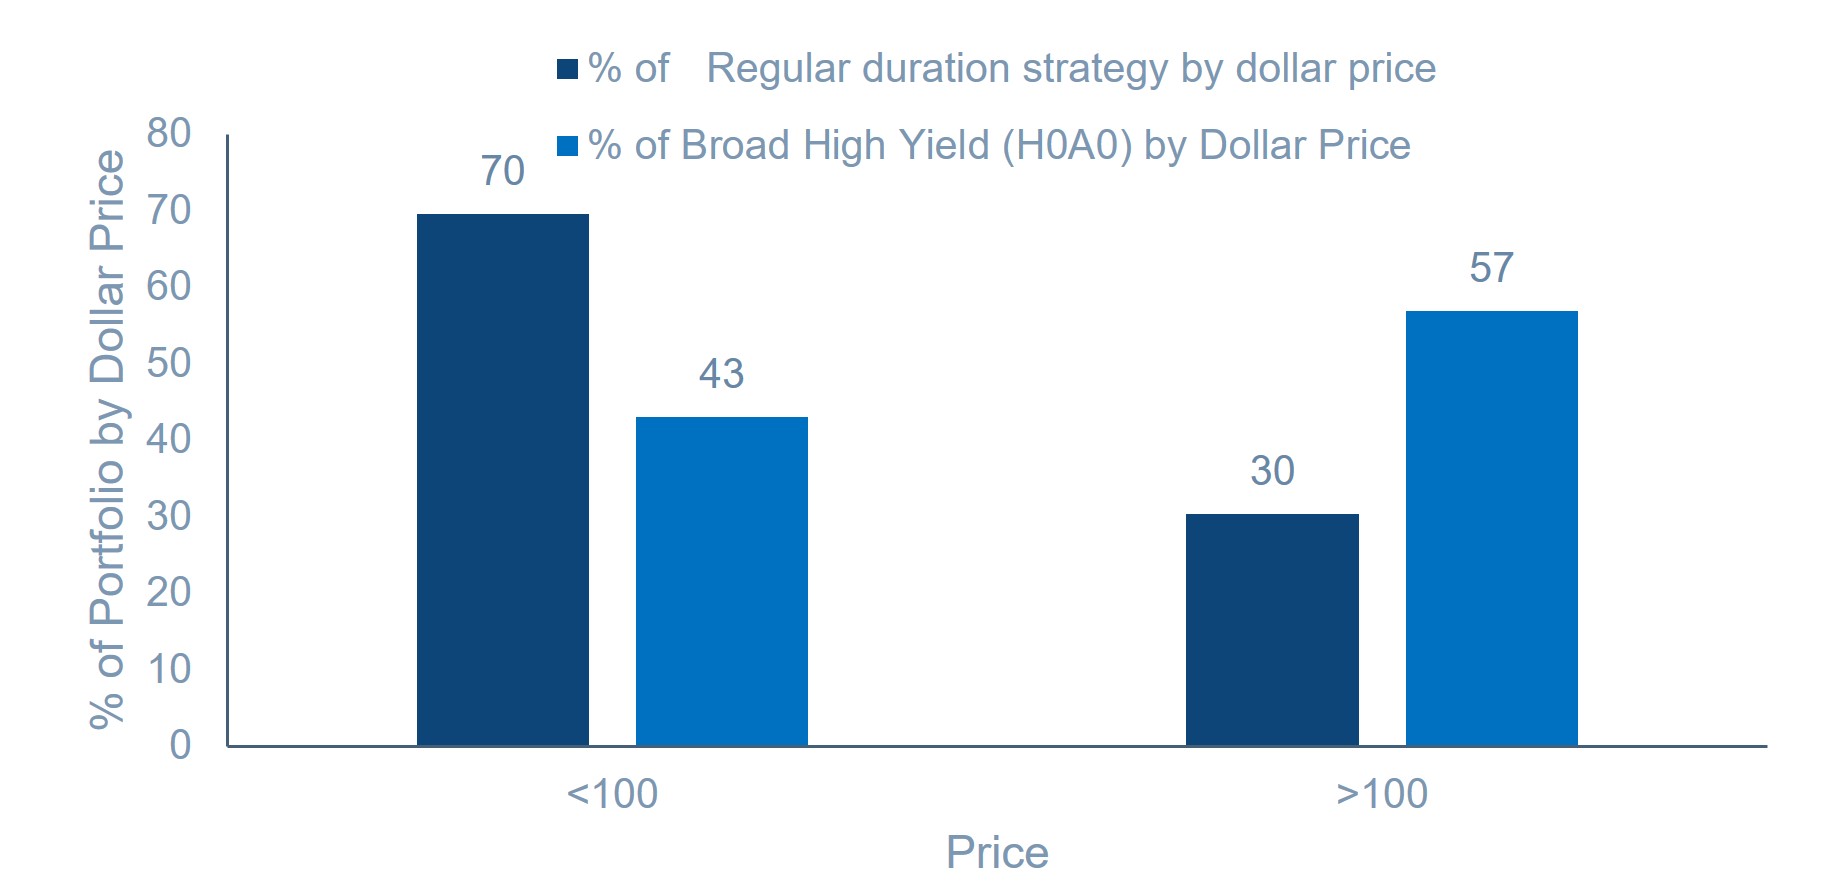
Instead of reaching for distressed yield to add alpha, we strive to build a structurally advantaged portfolio by overweighting below-par bonds across both our regular duration and short duration US high yield strategies. Below par bonds benefit from the pull toward par value as those bonds move closer to maturity and often outperform their stated “yield to worst” because high yield companies typically call bonds early, meaning the realized return is higher than the market quoted convention: “yield to worst”.
Focusing the strategy on below par bonds has been a deliberate multi-quarter campaign. We entered the year defensively given tight spreads, managing extension risk by holding more below-par paper than the market. We then leaned into medium-duration, below-par opportunities as spreads and yields backed up through the late first and early second quarter, when spreads widened by nearly 100bps. As spreads rallied back, we have been recycling repayments into more conservative credits and higher-quality floating-rate loans.
At time of writing, year-to-date spreads are now roughly unchanged despite a volatile round trip. The short-duration strategy’s duration now sits modestly below its long-term average target of 2, which we think leaves us well positioned to keep compounding this return stream without taking on unnecessary interest rate or credit risk. The regular duration strategy’s duration sits slightly below benchmark at 3 with an overweight to the belly of the curve and front end, combined with an underweight to longer duration bonds.
Figure 2 – Refinancing before maturity increases total return potential
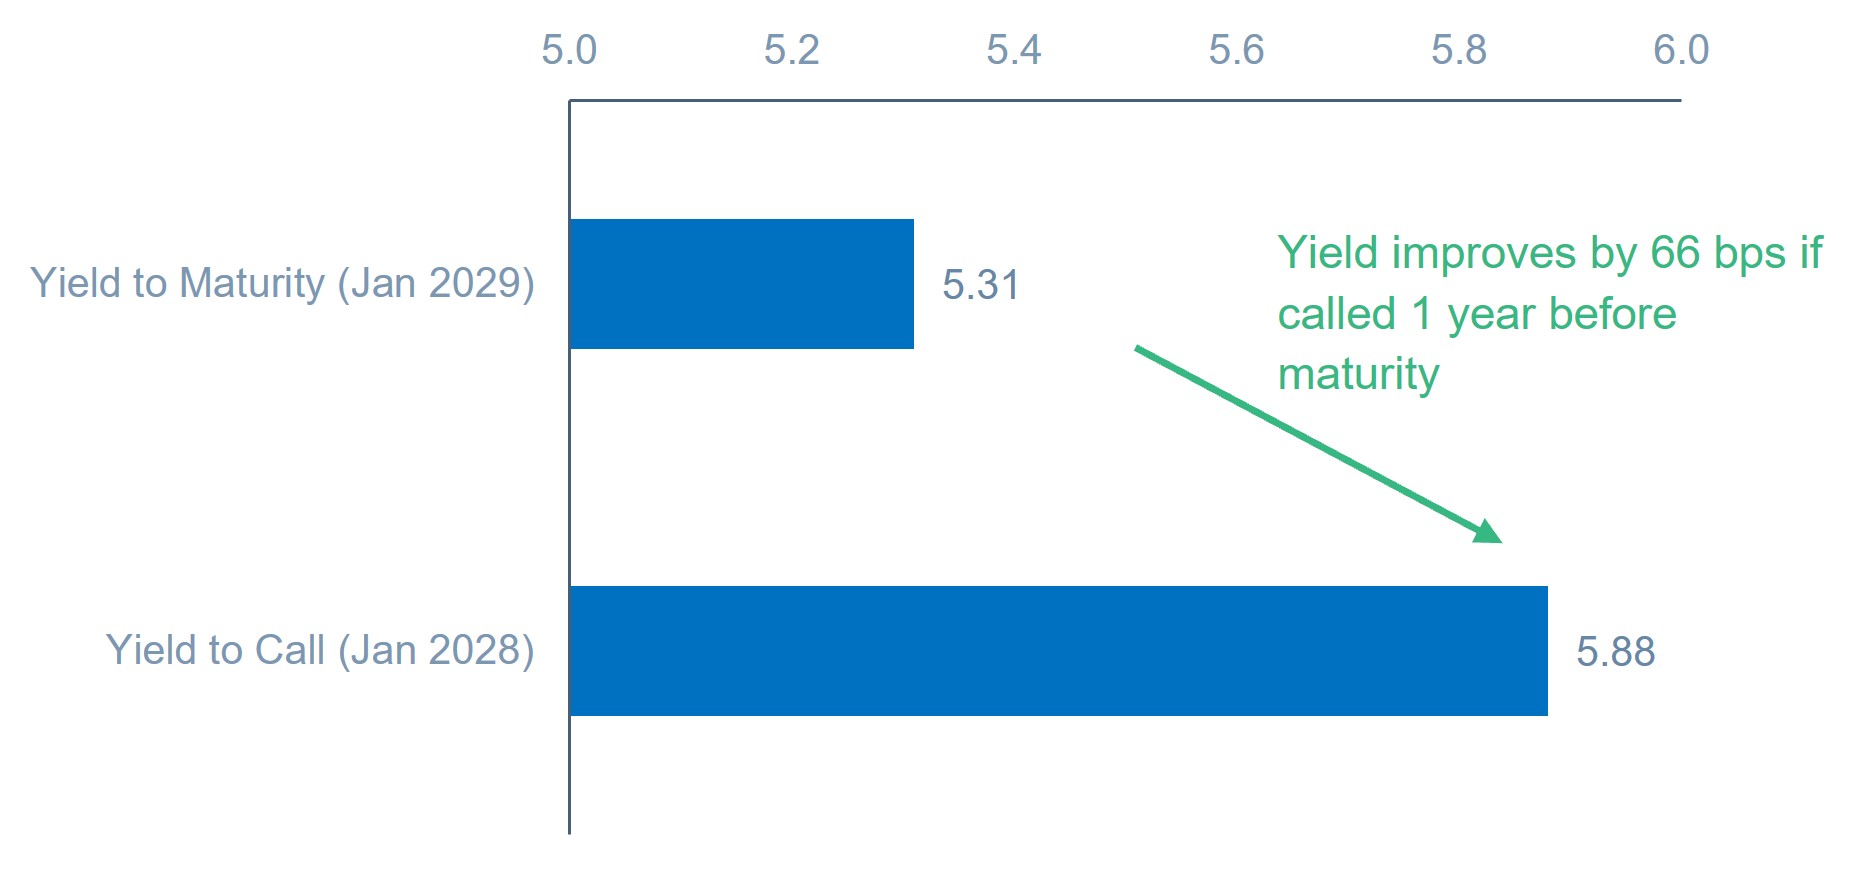
Figure 3 – Proactive positioning in below-par bonds
Source: Muzinich, ICE Index Platform and Bloomberg as of May 31st, 2026. ICE BofA US High Yield Index (H0A0). Index selected by Muzinich as best available proxy for the respective market. For illustrative purposes only.
Cycling risk: hunting for quality and value in disrupted sectors
Alpha generating opportunities this quarter came from a mix of sources. Issuers in sectors like airlines, packaging and autos were caught up directly in the disruption from the War in Iran. We sought out durable businesses with good balance sheets that saw temporary operating pressure, which we believe was more than priced in and left bonds in these sectors offering improved relative value.
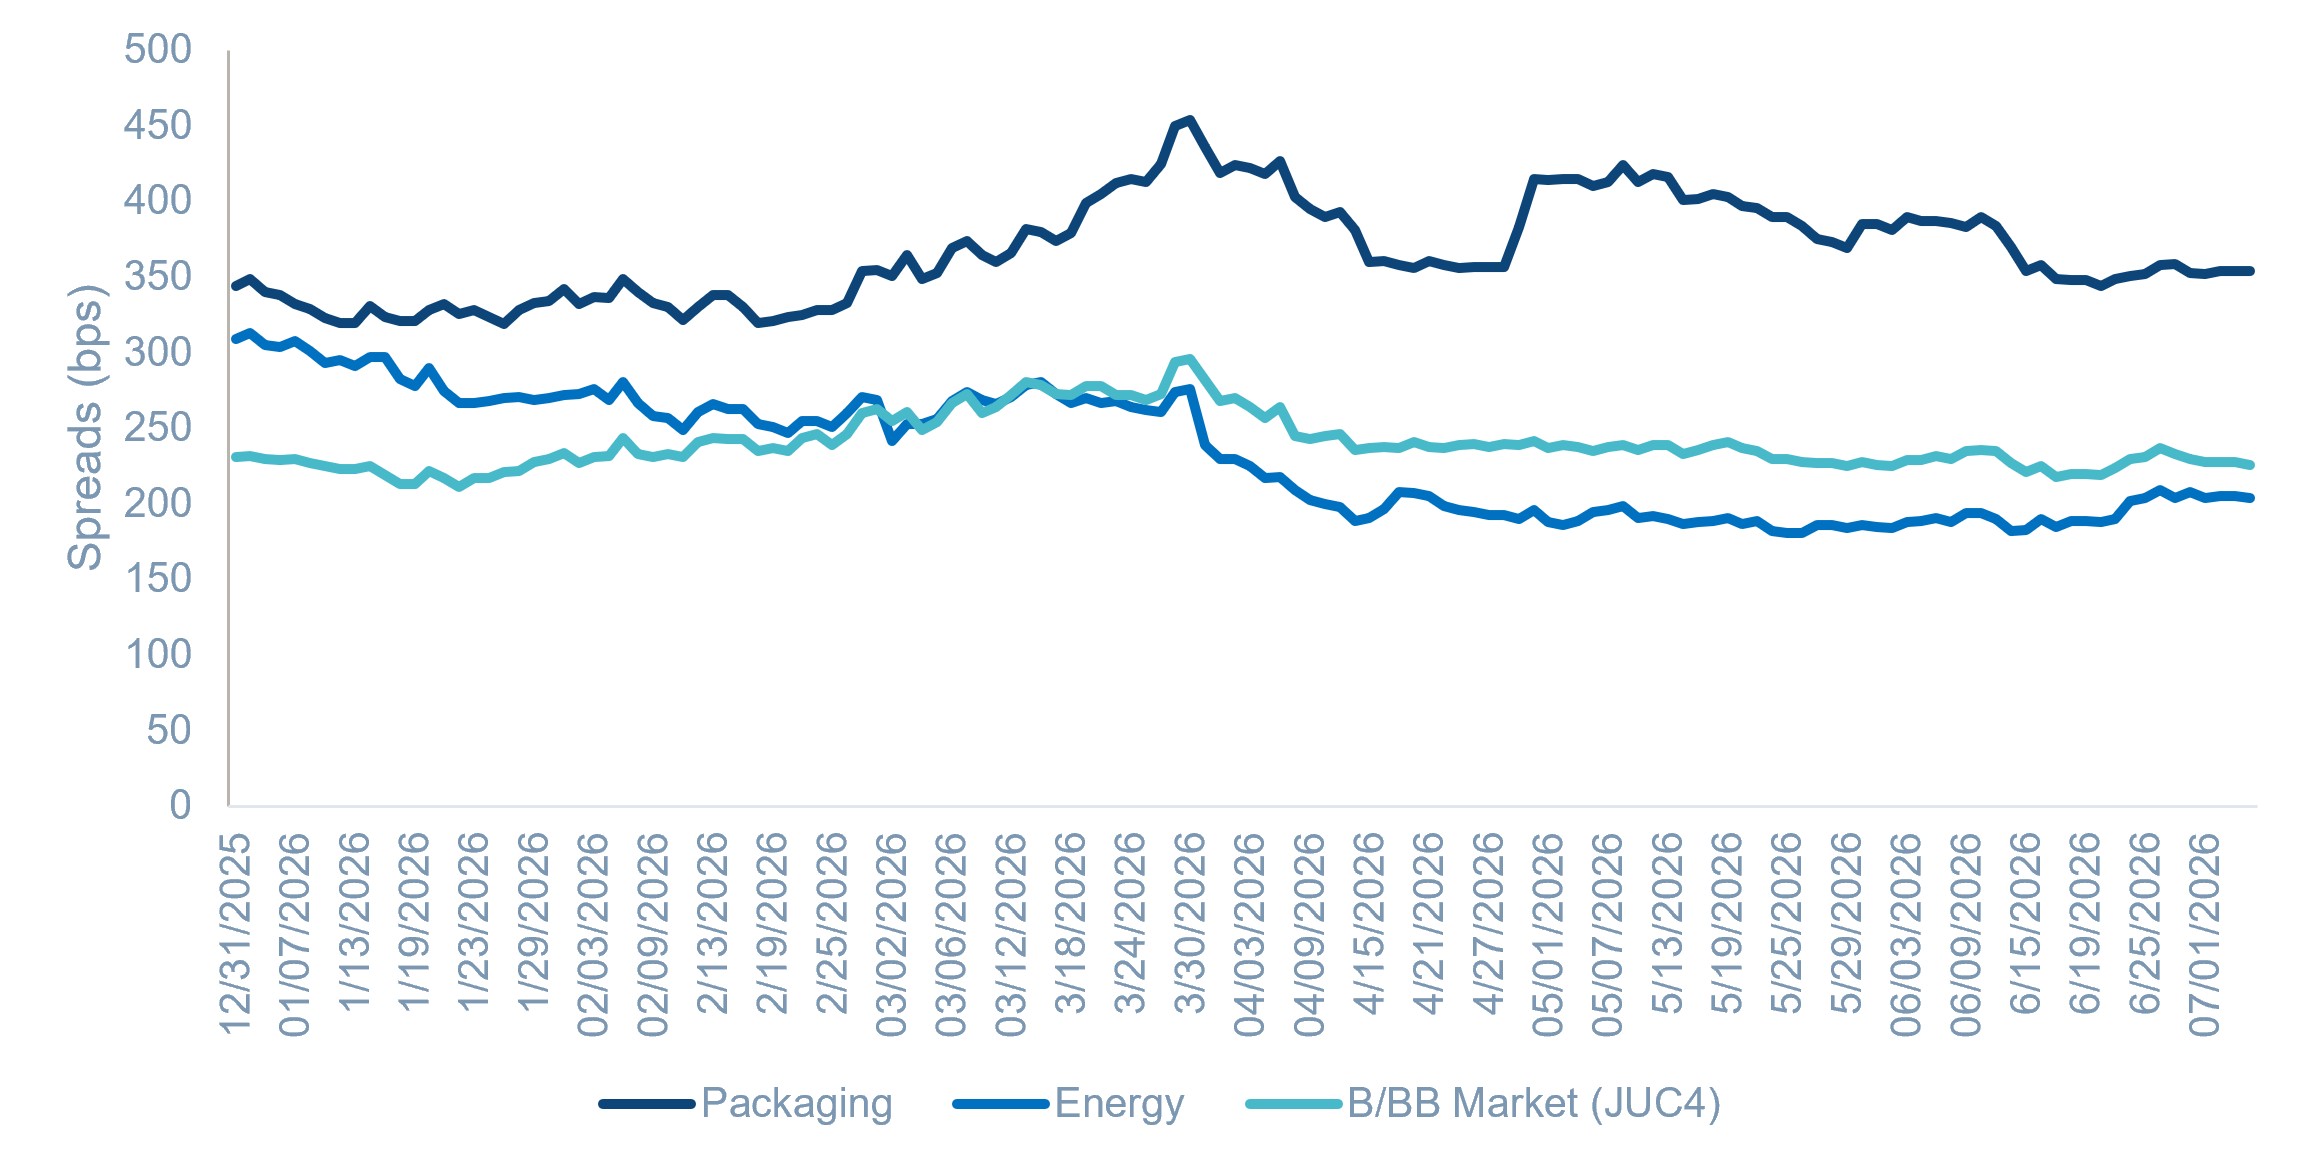
Figure 4 shows how the market moved throughout 2026 as oil spiked from the war: commodity producers in the energy sector benefitted while commodity consumers in the packaging sector sold-off. We added dislocated issuers in sectors like packaging while reducing energy exposure. Elsewhere, in sectors like real estate, financials and telecom, the opportunity was less about war-related disruption and more about finding fundamentally attractive businesses that the broader market had mispriced. In both cases, the strategy is the same: we're seeking out good businesses with good balance sheets trading cheap for reasons we think are temporary or overstated. We funded much of the rotation by trimming software, healthcare and cycling out of Energy names that had outperformed when oil prices were trading at US$100/barrel.
Fig. 4: B/BB market vs packaging and energy spreads
Source: ICE index Platform, as of 7th July 2026 ICE BofA US High Yield Containers Index (H0CT), ICE BofA US High Yield Energy Index (H0EN), ICE BofA BB-B US Cash Pay High Yield Constrained Index (JUC4).
Datacentres: selective, not sidelined
Nowhere is our relative value discipline more relevant than in data centre bonds, one of the fastest-growing corners of the high yield market this year. We're not dismissing the total return theme – long-dated, investment-grade-backed leases can offer a genuinely attractive risk/reward – but construction risk is real, and we have noted issuance where the compensation being offered to fund early-stage projects with lower quality counterparties is too low. We remain underweight and selective, focusing on deals close to completion with high-quality counterparties, and are prepared to add if valuations move in our favour rather than chasing the sector at today's levels.
Portfolio implications
This combination – avoiding phantom yield, earning carry through pull-to-par and opportunistic buying into good businesses trading cheap on temporary disruption – drove strong relative results across both strategies in June and for the quarter. The regular duration strategy outperformed the B/BB market in both periods, while the short-duration strategy outperformed the short duration US high yield market.3 An underweight to the energy sector has proved a relative headwind as oil prices surged following the conflict. Nevertheless, both strategies have continued to hold up well relative to the broader high yield market year to date.
An overweight to single-Bs and conservative duration positioning was a big driver for the regular duration strategy, alongside favourable selection in financial services, packaging and telecom while cycling out of higher-beta energy producers near the highs. True to its design, the short duration strategy again captured the majority of the market's upside (beating the broader market in this period) while running significantly less volatility. This is a pattern we strategically target and have seen play out both this year and historically.
Past performance is not a reliable indicator of current or future results and should not be the sole factor of consideration when selecting a product or strategy.
Where we go from here
We continue to see high yield fundamentals as stable: balance sheets are solid, liquidity is ample and the shrinking footprint of leveraged-buyout issuers supports a benign default outlook. Technicals should stay a touch noisy into July given heavy anticipated issuance – including further data centre supply and financing tied to the WBD-Paramount merger. However, demand continues to hold up well against resilient economic growth. Valuations are fair rather than cheap, with spreads and yields at levels that have historically preceded solid forward returns in the high single digits, but not levels that reward indiscriminate risk-taking. Against that backdrop, our approach stays the same: stay up in quality, let pull-to-par do the compounding, and use dislocation – rather than a reach for yield – as our primary driver of alpha.
References to specific companies is for illustrative purposes only and does not reflect the holdings of any specific past or current portfolio or account.
References
1. ICE Index Platform, as of 8th July 2026. ICE BofA US High Yield Index (H0A0)
2. ICE BofA BB-B US Cash Pay High Yield Constrained Index (JUC4)
3. ICE BofA 0-3 Year Duration-to-Worst BB-B Cash Pay US High Yield Constrained Index (J4CS)
This material is not intended to be relied upon as a forecast, research, or investment advice, and is not a recommendation, offer or solicitation to buy or sell any securities or to adopt any investment strategy. The opinions expressed by Muzinich & Co. are as of July 2026 and may change without notice.
--------
Index descriptions
J4CS - The ICE BofA 0-3 Year Duration-To-Worst BB-B Cash Pay US High Yield Constrained Index tracks the performance of short maturity US dollar denominated below investment grade corporate debt, currently in a coupon paying period that is publicly issued in the US domestic market.
H0A0 – The ICE BofA US High Yield Index tracks the performance of US dollar denominated below investment grade corporate debt publicly issued in the US domestic market.
JUC4 - The ICE BofA BB-B US Cash Pay High Yield Constrained Index contains all securities in the ICE BofA US Cash Pay High Yield Index (J0A0) rated BB1 through B3, based on an average of Moody's, S&P and Fitch, but caps issuer exposure at 2%.
Important information
Muzinich and/or Muzinich & Co. referenced herein is defined as Muzinich & Co., Inc. and its affiliates. Muzinich views and opinions. This material has been produced for information purposes only and as such the views contained herein are not to be taken as investment advice. Opinions are as of date of publication and are subject to change without reference or notification to you. Past performance is not a reliable indicator of current or future results and should not be the sole factor of consideration when selecting a product or strategy. The value of investments and the income from them may fall as well as rise and is not guaranteed and investors may not get back the full amount invested. Rates of exchange may cause the value of investments to rise or fall.
Any research in this document has been obtained and may have been acted on by Muzinich for its own purpose. The results of such research are being made available for information purposes and no assurances are made as to their accuracy. Opinions and statements of financial market trends that are based on market conditions constitute our judgment and this judgment may prove to be wrong. The views and opinions expressed should not be construed as an offer to buy or sell or invitation to engage in any investment activity, they are for information purposes only.
This discussion material contains forward-looking statements, which give current expectations of future activities and future performance. Any or all forward-looking statements in this material may turn out to be incorrect. They can be affected by inaccurate assumptions or by known or unknown risks and uncertainties. Although the assumptions underlying the forward-looking statements contained herein are believed to be reasonable, any of the assumptions could be inaccurate and, therefore, there can be no assurances that the forward-looking statements included in this discussion material will prove to be accurate. In light of the significant uncertainties inherent in the forward-looking statements included herein, the inclusion of such information should not be regarded as a representation that the objectives and plans discussed herein will be achieved. Further, no person undertakes any obligation to revise such forward-looking statements to reflect events or circumstances after the date hereof or to reflect the occurrence of unanticipated events.
United Arab Emirates (UAE): This information is provided for discussion and informational purposes only and does not constitute an offer or solicitation in the UAE. It is intended solely for Professional Investors and should not be relied upon by any other person. This material has not been reviewed or approved by the UAE Securities and Commodities Authority, the UAE Central Bank or any other relevant authority. Nothing contained herein constitutes investment, legal, tax or other professional advice. Recipients should make their own independent assessment where appropriate.
Abu Dhabi Global Market (ADGM): This information is provided for discussion and informational purposes only and does not constitute an offer or solicitation in the ADGM. It is intended solely for Professional Clients (as defined by the Financial Services Regulatory Authority) and should not be relied upon by any other person. This material has not been reviewed or approved by the Financial Services Regulatory Authority or any other relevant authority in the UAE.
United States: This material is for Institutional Investor use only – not for retail distribution. Muzinich & Co., Inc. is a registered investment adviser with the Securities and Exchange Commission (SEC). Muzinich & Co., Inc.’s being a Registered Investment Adviser with the SEC in no way shall imply a certain level of skill or training or any authorization or approval by the SEC.
Issued in the European Union by Muzinich & Co. (Ireland) Limited, which is authorized and regulated by the Central Bank of Ireland. Registered in Ireland, Company Registration No. 307511. Registered address: 32 Molesworth Street, Dublin 2, D02 Y512, Ireland. Issued in Switzerland by Muzinich & Co. (Switzerland) AG. Registered in Switzerland No. CHE-389.422.108. Registered address: Tödistrasse 5, 8002 Zurich, Switzerland. Issued in Singapore and Hong Kong by Muzinich & Co. (Singapore) Pte. Limited, which is licensed and regulated by the Monetary Authority of Singapore. Registered in Singapore No. 201624477K. Registered address: 6 Battery Road, #26-05, Singapore, 049909. Issued in all other jurisdictions (excluding the U.S.) by Muzinich & Co. Limited. which is authorized and regulated by the Financial Conduct Authority. Registered in England and Wales No. 3852444. Registered address: 8 Hanover Street, London W1S 1YQ, United Kingdom. 2026-07-08-18926

Key Takeaways
Multiple drivers of return: Pull-to-par, carry and disciplined security selection continue to generate performance, reducing reliance on spread tightening.
Selective value creation: The best opportunities are found in fundamentally strong businesses temporarily mispriced by market dislocations, while remaining disciplined in richly valued sectors like data centres.
By clicking "Submit", I am (i) signing up to receive the Opinion Pieces from the "Opinions" page of the Muzinich & Co website, (ii) representing that the above information is true and accurate and (iii) agreeing to join the Muzinich & Co mailing list. I understand that Muzinich & Co will not add retail investors or individuals with personal email addresses to its mailing list and represent that I am not a retail investor. By providing my personal and professional information I am consenting to its use and disclosure in accordance with the Muzinich & Co. Privacy Policy. I understand that I may withdraw my consent and unsubscribe from receiving future communications by clicking "Unsubscribe" from the emails that are sent to me from Muzinich & Co.

Oct 09, 2026
US High Yield: Compelling opportunity to add higher- quality yield
Following a sharp sell-off in US high yield, improved valuations are creating an opportunity to add higher-quality yield. With fundamentals remaining resilient and dispersion increasing, we believe the current environment is rich with the potential for strong-risk adjusted investment opportunities.

Sep 23, 2026
The hidden return in high yield
Much of the European high yield market is trading below par again - headline yield does not show what a potential early call is worth.

Aug 18, 2026
High yield’s AI era: Assessing the data center buildout
The rapid growth of data-center issuance is reshaping the US high yield market. While echoes of previous investment cycles remain, contracted cashflows and stronger counterparties are creating opportunities for investors able to navigate construction and credit risk.