Rare earths: Where geology meets geopolitics
EM Monthly
September 10, 2025
If you have any feedback on this article or are interested in subscribing to our content, please contact us at opinions@muzinich.com or fill out the form on the right hand side of this page.
--------
With rare earth elements a key component in the production and development of clean energy technology and other critical IT resources, whoever controls their supply has a much broader geopolitical influence, as Warren Hyland explains.
Rare earth elements (REEs) may not be as scarce as the name suggests, but their extraction, processing and control have become among the most critical issues in global geopolitics.
Once obscure scientific curiosities unearthed in an 18th-century Swedish quarry, they now underpin technologies driving the 21st-century economy - from electric vehicles and renewable energy to advanced defence systems. Their strategic importance has transformed them into leverage points of power, shaping trade disputes and influencing diplomatic relations in an increasingly multipolar world.
Figure 1:Rare-earth elements in the Periodic Table
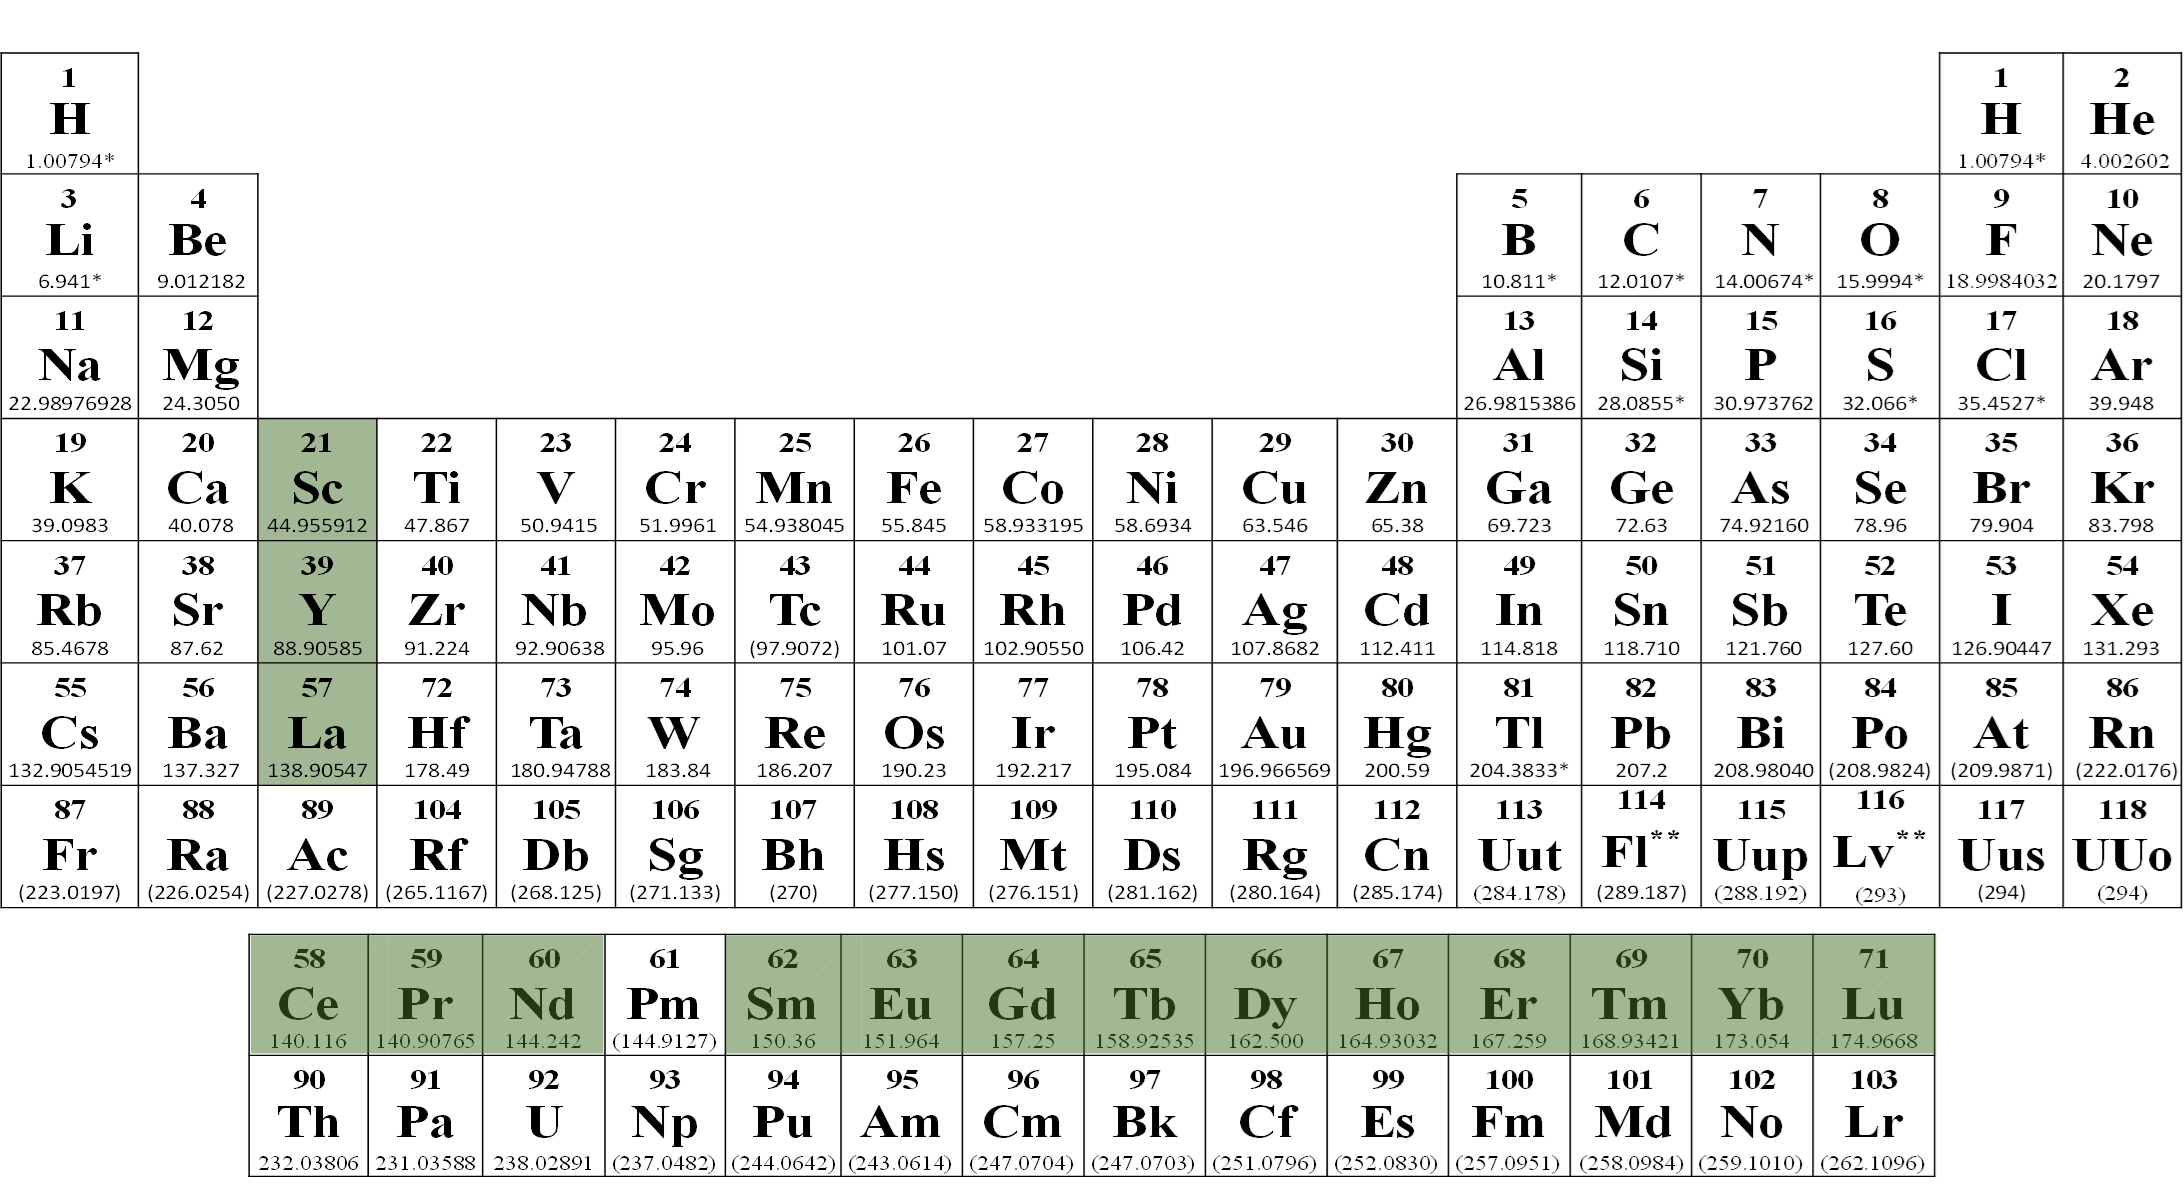
Source: The Economist, as of 24th March 2025. For illustrative purposes only. Rare earth elements: Scandium, Yttrium, Lanthanum, Cerium, Praseodymium, Neodymium, Samarium, Europium, Gadolinium, Terbium, Dysprosium, Holmium, Erbium, Thulium, Ytterbium, Lutetium
An elemental discovery
In 1787, in the small village of Ytterby near Stockholm, Swedish army officer and amateur chemist Carl Axel Arrhenius made a discovery that would change the scientific world. In a local quarry, he found an unusual black mineral called ytterbite (later renamed gadolinite). This led to the identification of yttrium in 1794 - the first of what would eventually become a group of 17 elements now known as the REEs.1
Thanks to the pioneering efforts of early chemists, the Ytterby quarry became one of the most scientifically significant sites in history, laying the groundwork for our modern understanding of the periodic table.
Cerium, which plays a key role in catalytic converters, is more abundant in the Earth’s crust than copper. Neodymium, a key component in high-strength magnets found in electric vehicles, wind turbines, computer hard drives and headphones, is more abundant than lead. The term “rare” references the difficulty of extracting and separating them. Unlike gold or copper, which are often found in rich, concentrated deposits, REEs are typically dispersed in low concentrations across wide areas.
Adding to the challenge, REEs are chemically similar, meaning they can often be found together in the same ores and require complex and energy-intensive processing to separate and refine.
In recent years, global demand for REEs has surged, driven by their essential role in clean energy technologies, consumer electronics and national defence systems. In the US, REEs are now regarded as strategic resources, vital for maintaining technological superiority, safeguarding national security and ensuring economic competitiveness. However, a glut in production at the turn of the century resulted in a shift in production control from West to East.
Figure 2:Rare-earth elements in industry
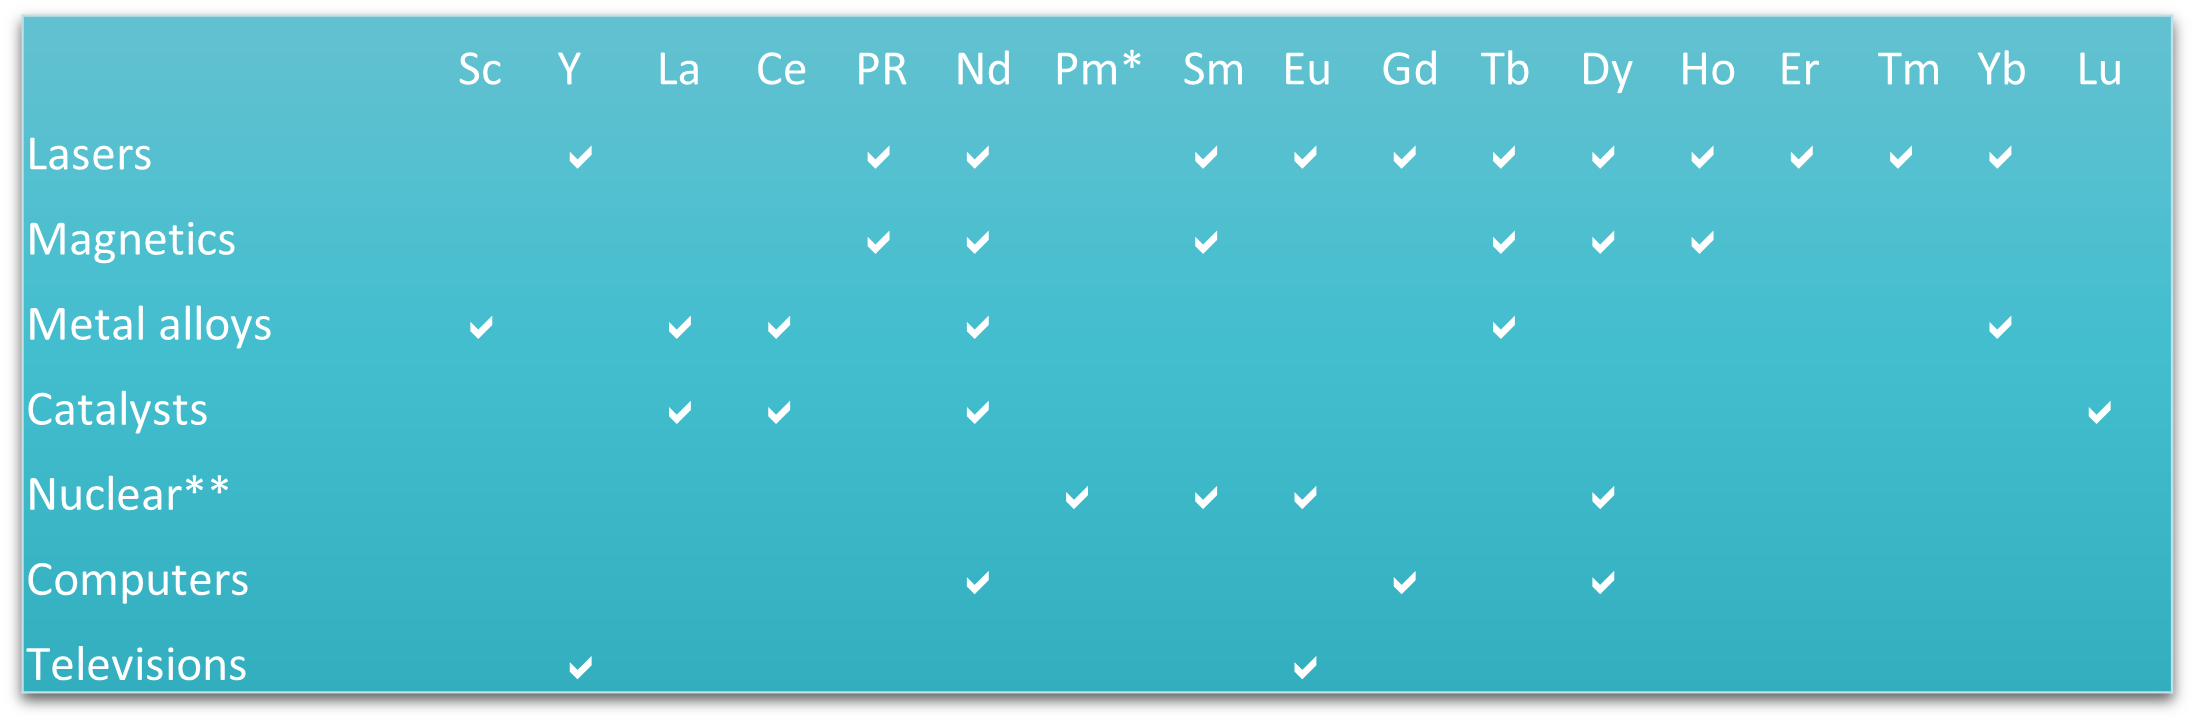
*Not classed a critical mineral by the US Department of Energy **Reactors or batteries.
Note: Elements listed in order of Scandium, Yttrium, Lanthanum, Cerium, Praseodymium, Neodymium, Promethium, Samarium, Europium, Gadolinium, Terbium, Dysprosium, Holmium, Erbium, Thulium, Ytterbium and Lutetium.
Source: The Economist, as of 24th March 2025. For illustrative purposes only.
Eastern influence
China began mining rare earths in the 1950s,2 initially lagging the US, which had discovered rare-earth deposits in the 1940s while searching for uranium to fuel its atomic weapons programme. In the 1980s, under Deng Xiaoping’s market-oriented reforms, Beijing granted licenses to local governments, spurring rapid industrialization of the rare-earth sector. Hundreds of mining firms sprang up, and by the 2000s the resulting glut forced America’s main mine, Mountain Pass, to shut down. Today, Chinese producers dominate rare-earth markets, accounting for roughly 70% of global output and an astonishing 90% of processing capacity.2
Figure 3: Production of rare-earth oxides, ‘000 tonnes per annum
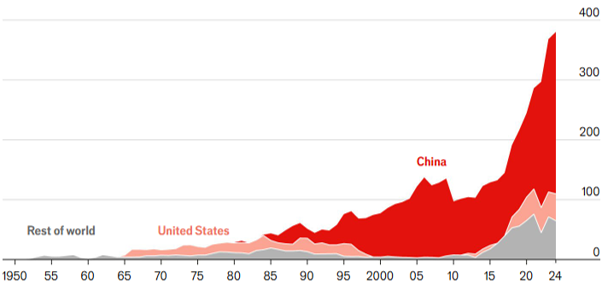
Source: The Economist, as of 13th August 2025. For illustrative purposes only.
Under Xi, China has leveraged its dominance through a system of export controls. Officials closely monitor the end users of rare-earth shipments and can revoke licenses at will.
The costs of restricting exports are strikingly asymmetrical: entire foreign industries can be disrupted for just tens of millions of dollars in forgone sales. This has left the US vulnerable and is one of the reasons for the Trump administration’s fascination with Greenland, a country rich in rare-earth deposits. Similarly, access to Ukraine’s rare-earth reserves has surfaced in negotiations tied to American military support.
Tariff tensions
In April 2025, trade tensions between the US and China escalated sharply, with the US imposing massive tariffs on Chinese goods, peaking at 145%. Beijing responded in kind, raising tariffs on US imports to 125%.3
However, China faced a significant comparative disadvantage as it runs a large trade surplus with the US – it was a war they couldn’t win.
This prompted the Chinese to shift tactics, imposing export restrictions on seven critical rare earth elements, including neodymium and dysprosium, which are essential for manufacturing electric vehicle motors and wind turbines. The US faced the prospect of severe disruptions to vital industries such as autos, aerospace and defence - threatening its economy and national security. This forced the US back to the negotiation table.
The tactic appears to have been effective: after the flow of rare earths resumed, President Trump reversed restrictions on Chinese student visas, lifted limits on the sale of certain Nvidia chips and postponed a significant increase in import duties (Figure 4). On August 11, the US and China extended their trade truce for an additional 90 days.
References to specific companies is for illustrative purposes only and does not reflect the holdings of any specific past or current portfolio or account.
Figure 4: 2025 US and China tariff war
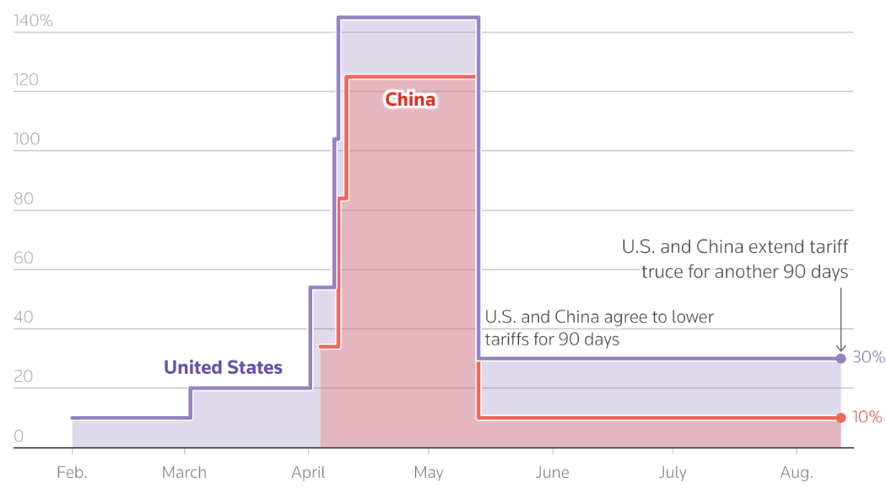
Step chart showing the rising tariffs imposed by the US and China against each other since February 1.
Note: Data covers tariffs imposed against all imported goods for either countries. The US and China have slapped separate specific tariffs on select goods like steel and agricultural products, which come of top of these duties.
Reuters, as of 12th August 2025. For illustrative purposes only.
Since taking office for a second time, we believe Trump has sought to exploit the US’s position as the world’s largest consumer market - accounting for roughly 30% of global consumer spending4 and running trade deficits with much of the world - to advance its geopolitical agenda.
However, China possesses a counterbalance. In the near term, we should expect an uneasy truce to persist between the two global superpowers: China relies on the US consumer, while the US depends on Chinese-manufactured rare earths. The longer-term picture is more nuanced as both nations will work to reduce their reliance on each other.
Strategic leverage and investment opportunity
The global contest over rare earth elements illustrate how control over critical resources can shift the dynamics of power between nations. For China, dominance in mining and processing has provided an economic and strategic counterweight to America’s consumer clout. For the US, the challenge lies in diversifying supply chains and investing in alternatives to reduce vulnerability.
As demand for clean energy and digital technologies accelerates, rare earths will remain at the heart of opportunity and rivalry. Ultimately, the question is not only who controls these elements today, but how nations will secure them tomorrow to safeguard innovation, national security and economic resilience.
Rare earth elements represent more than just a commodity - they are a strategic asset class for emerging market investors. Countries such as Brazil, India and Malaysia, which hold substantial rare earth deposits, are increasingly seen as alternative sources to China, offering opportunities for investors to gain exposure to potential supply diversification and rising global demand.
Many of these governments actively support mining and processing initiatives through subsidies, tax incentives and infrastructure development, creating a favourable environment for investment. At the same time, the rapid growth of technologies such as electric vehicles, wind turbines and advanced electronics is driving robust demand for rare earths, making companies involved in mining, refining, or downstream manufacturing particularly attractive.
Rare earths are also tied to geopolitical considerations, as resource-rich emerging markets may gain strategic leverage in global markets, adding another dimension to their investment potential. By understanding the interplay between supply, technological demand and government policy, investors can position themselves to capitalize on this high-growth sector.
EM look back – August
Fixed income
EM Credit
Monetary policy
Past performance is not a reliable indicator of current or future results.
References to specific companies is for illustrative purposes only and does not reflect the holdings of any specific past or current portfolio or account.
Country-specific news
All sources are Bloomberg unless otherwise stated.
This material is not intended to be relied upon as a forecast, research, or investment advice, and is not a recommendation, offer or solicitation to buy or sell any securities or to adopt any investment strategy. The opinions expressed by Muzinich & Co. are as of September 2025 and may change without notice.
Market Data
Credit
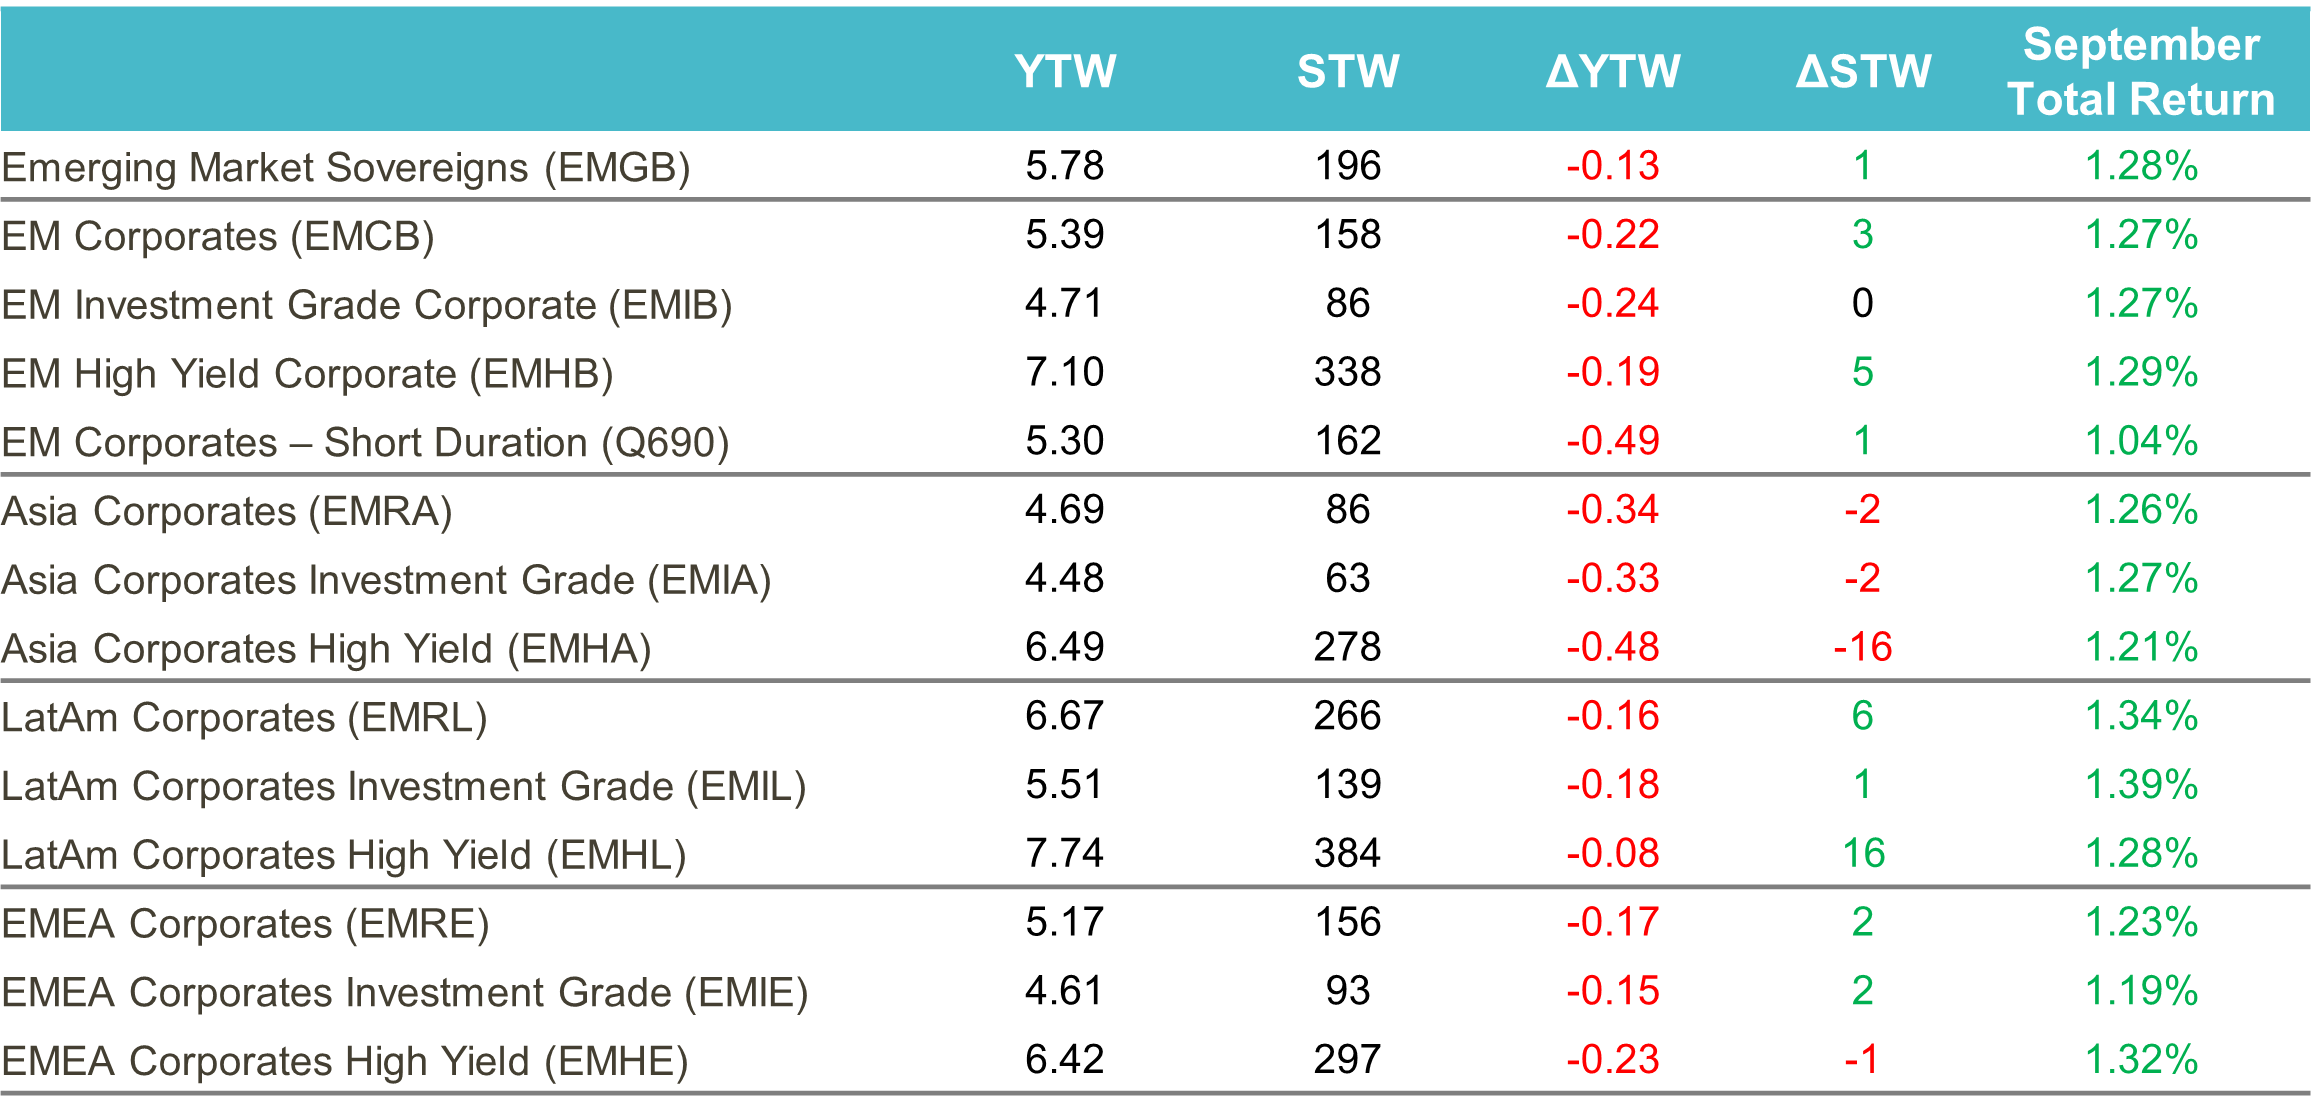
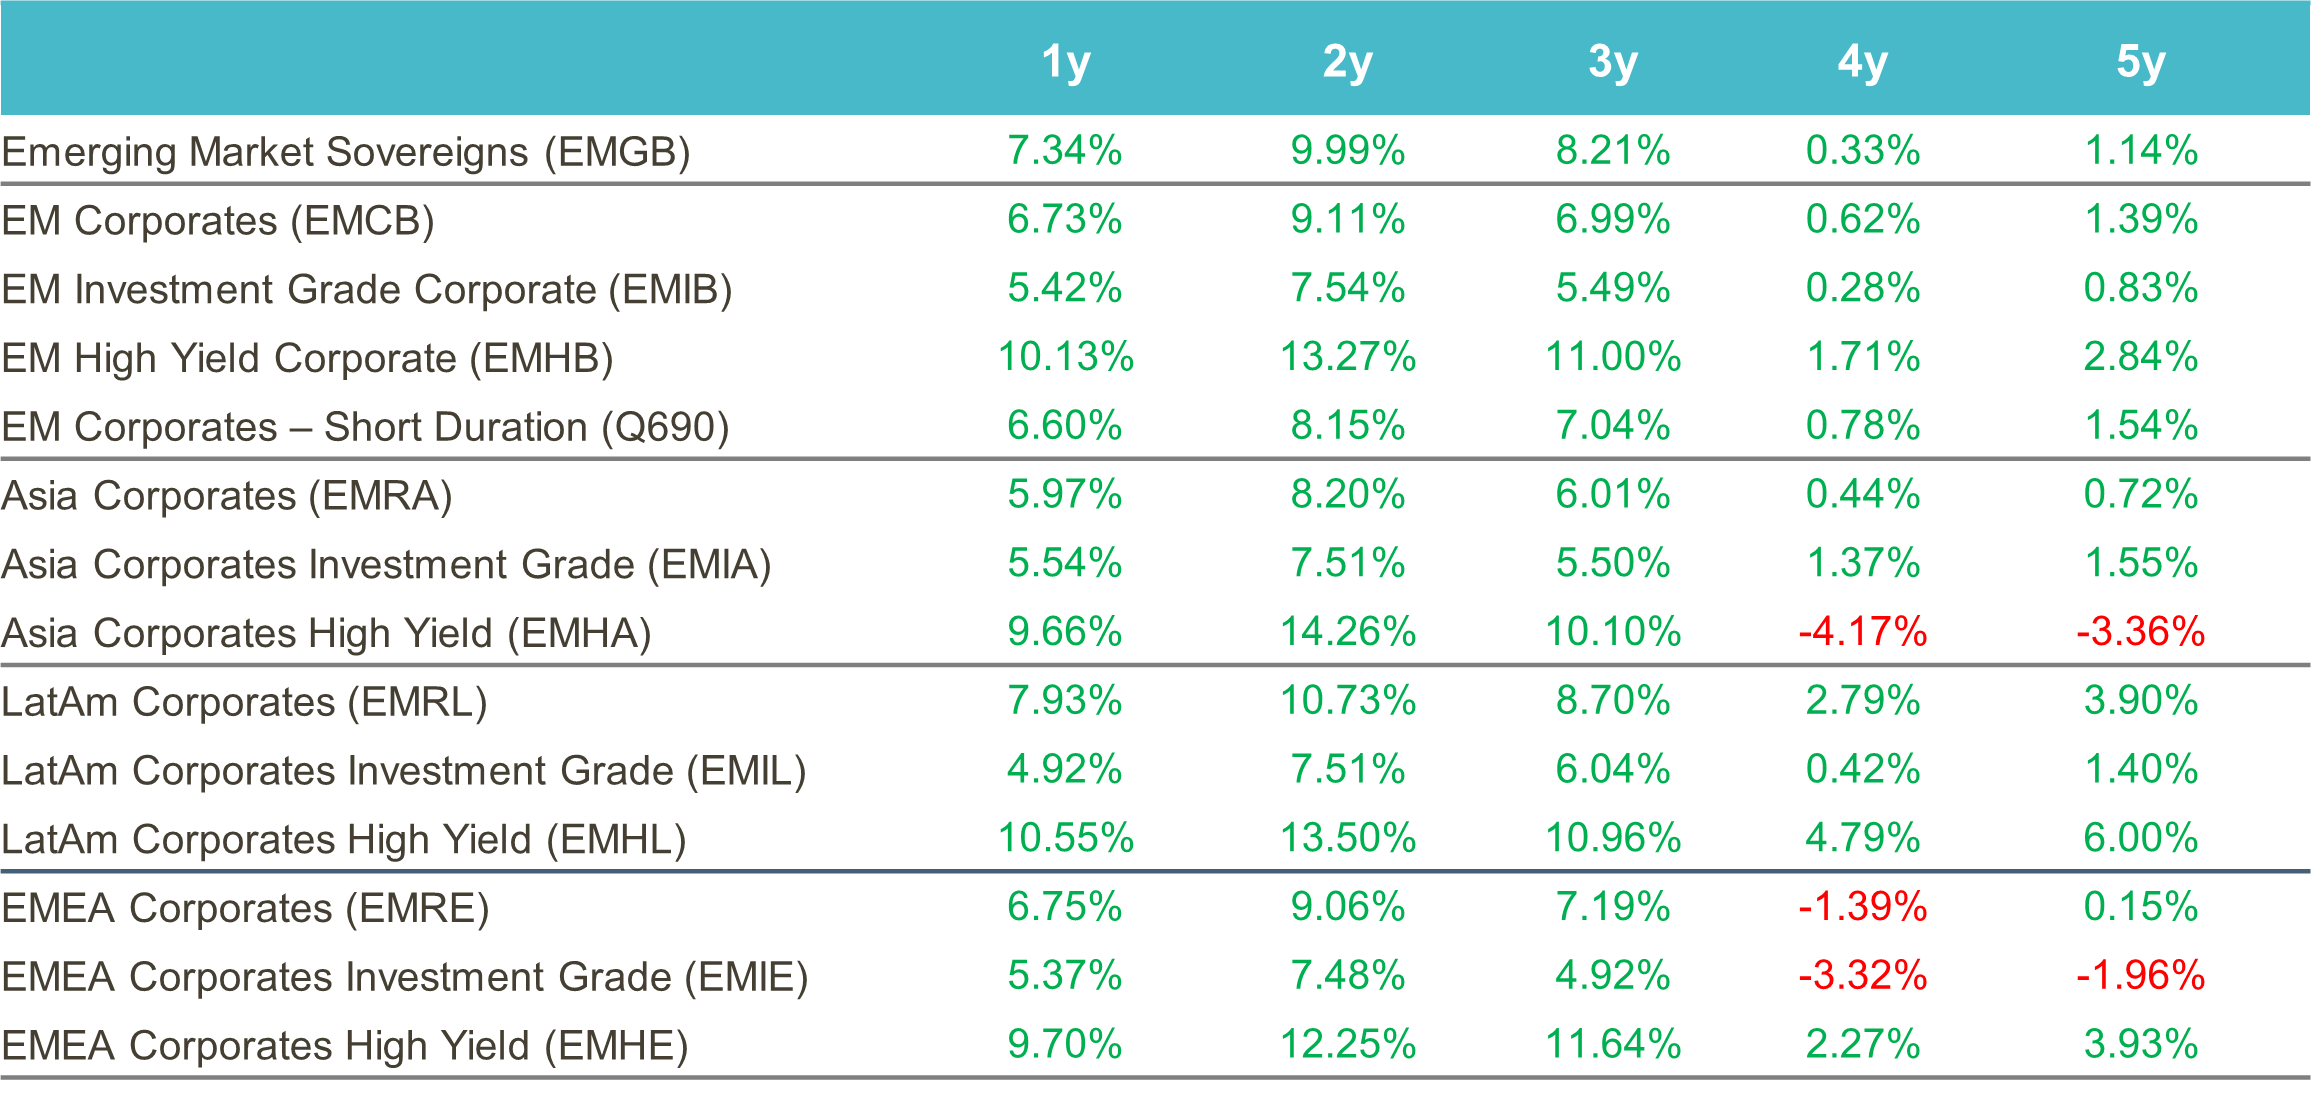
Past performance is not a reliable indicator of current or future results.
Source: ICE data platform. as of 31st August 2025. EMGB - ICE BofA Emerging Markets External Sovereign Index EMCB - ICE BofA Emerging Markets Corporate Plus Index, EMIB - ICE BofA High Grade Emerging Markets Corporate Plus Index, EMHB - ICE BofA High Yield Emerging Markets Corporate Plus Index, Q690 - ICE BofA Custom Emerging Markets Short Duration Index, EMRA - ICE BofA Asia Emerging Markets Corporate Plus Index, EMIA - ICE BofA High Grade Asia Emerging Markets Corporate Plus Index, EMHA - ICE BofA High Yield Asia Emerging Markets Corporate Plus Index , EMRL - ICE BofA Latin America Emerging Markets Corporate Plus Index, EMIL - The ICE BofA High Grade Latin America Emerging Markets Corporate Index, EMHL - ICE BofA High Yield Latin America Emerging Markets Corporate Plus, EMRE - ICE BofA EMEA Emerging Markets Corporate Plus Index, EMIE - ICE BofA High Grade EMEA Emerging Markets Corporate Plus Index, EMHE - ICE BofA High Yield EMEA Emerging Markets Corporate Plus Index,. Index performance is for illustrative purposes only. You cannot invest directly in the index. Indices selected provide best proxy for highlighting performance of emerging market corporate bonds. For illustrative purposes only.
Yield to Worst
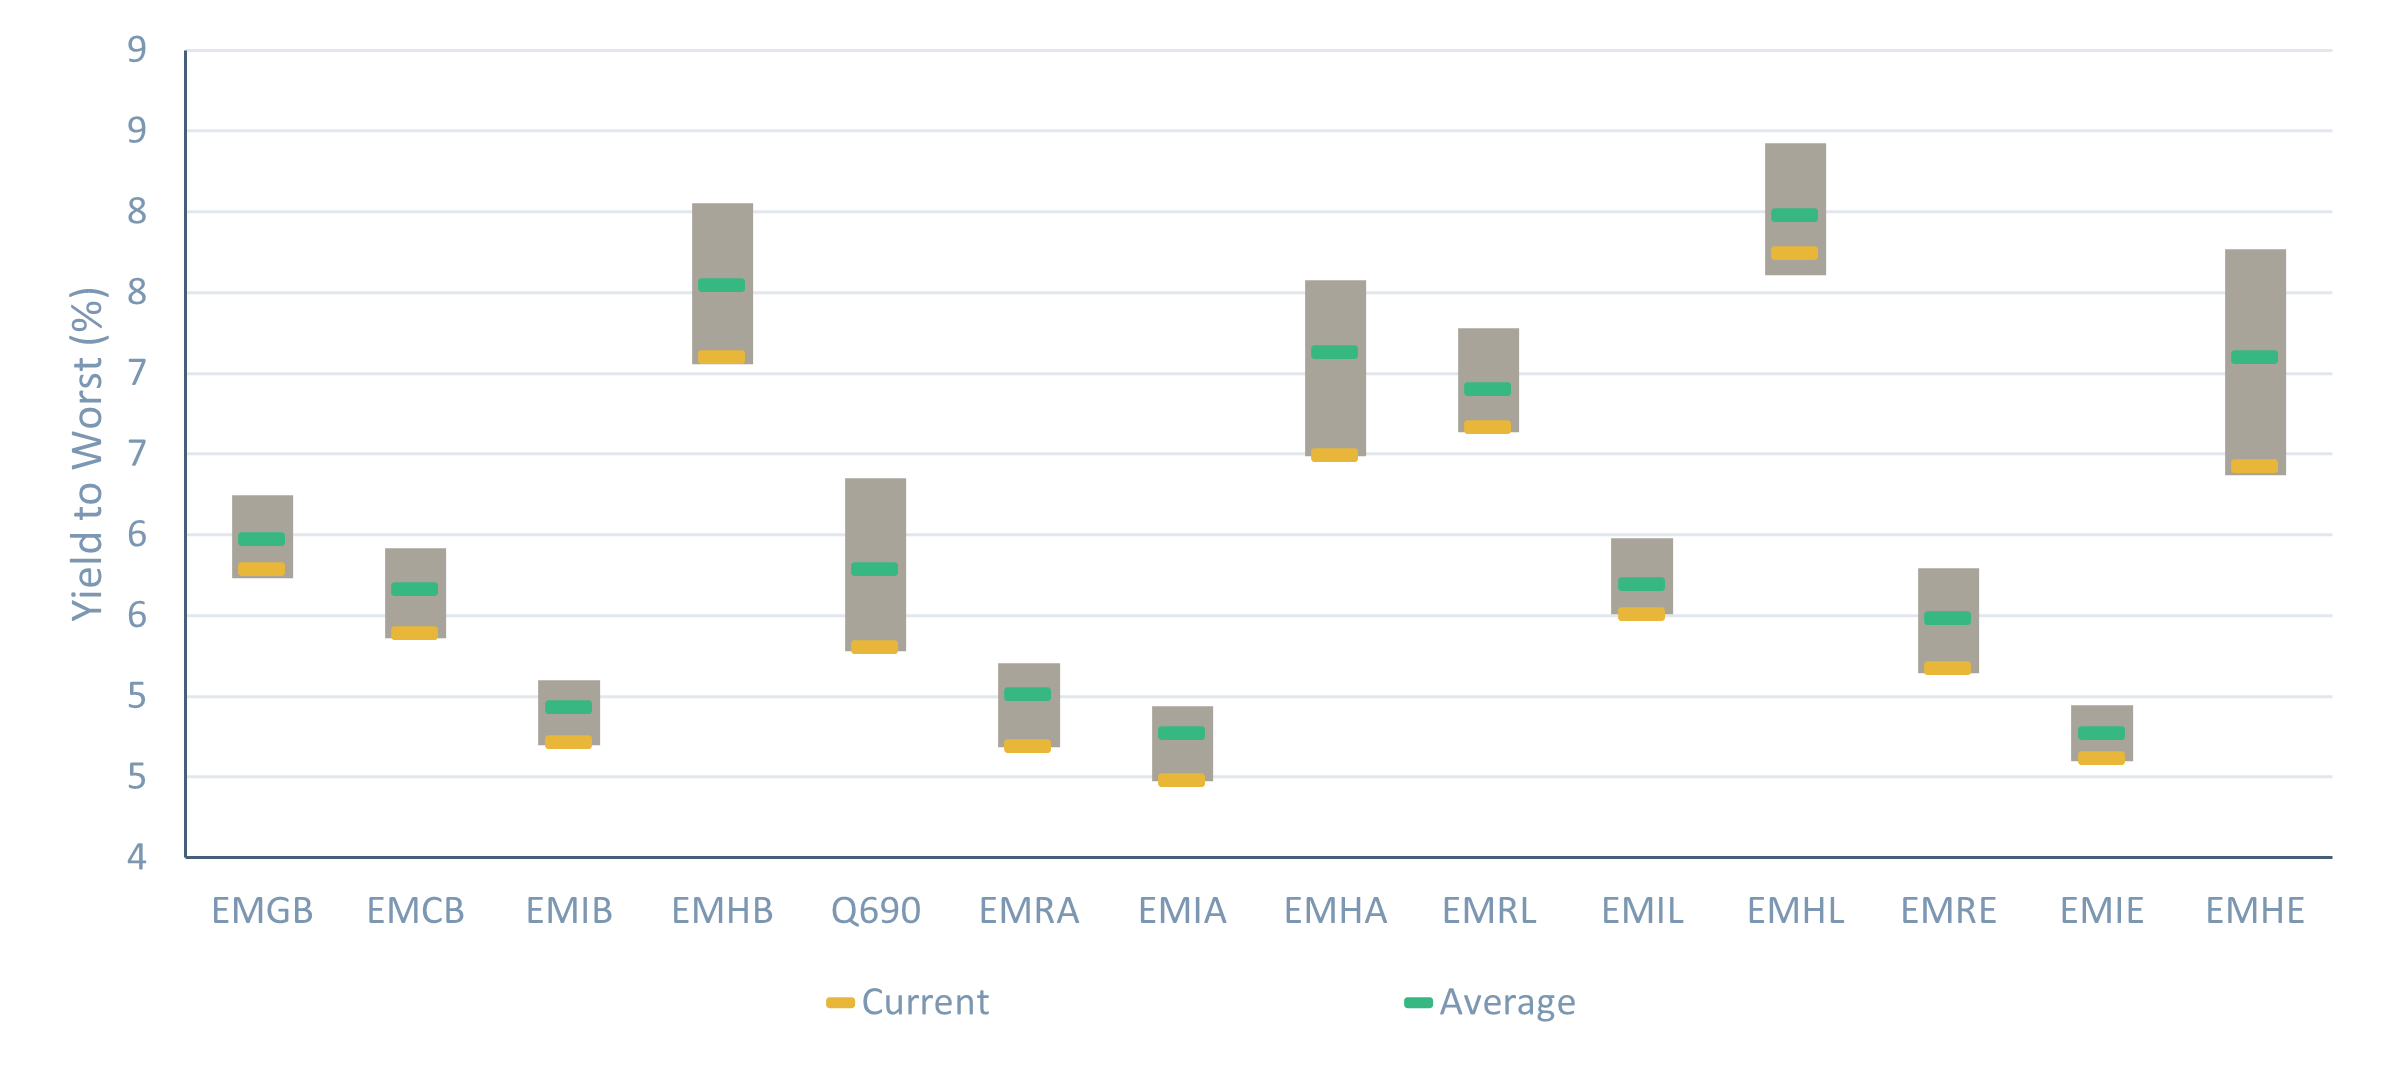
Source: ICE data platform. as of 31st August 2025. EMGB - ICE BofA Emerging Markets External Sovereign Index EMCB - ICE BofA Emerging Markets Corporate Plus Index, EMIB - ICE BofA High Grade Emerging Markets Corporate Plus Index, EMHB - ICE BofA High Yield Emerging Markets Corporate Plus Index, Q690 - ICE BofA Custom Emerging Markets Short Duration Index, EMRA - ICE BofA Asia Emerging Markets Corporate Plus Index, EMIA - ICE BofA High Grade Asia Emerging Markets Corporate Plus Index, EMHA - ICE BofA High Yield Asia Emerging Markets Corporate Plus Index , EMRL - ICE BofA Latin America Emerging Markets Corporate Plus Index, EMIL - The ICE BofA High Grade Latin America Emerging Markets Corporate Index, EMHL - ICE BofA High Yield Latin America Emerging Markets Corporate Plus, EMRE - ICE BofA EMEA Emerging Markets Corporate Plus Index, EMIE - ICE BofA High Grade EMEA Emerging Markets Corporate Plus Index, EMHE - ICE BofA High Yield EMEA Emerging Markets Corporate Plus Index,. Index performance is for illustrative purposes only. You cannot invest directly in the index. Indices selected provide best proxy for highlighting performance of emerging market corporate bonds. For illustrative purposes only.
References
1.Wikipedia, Rare-earth element, as of 6th September 2025.
2.The Economist, as of 13th August 2025. China’s power over rare earths is not as great as it seems.
3.Reuters, as of 11th April 2025. China raises duties on US goods to 125%m calls Trump tariff hikes a ‘joke'
4.HSBC Global Research, as of 21st August 2023. The future US consumer.
--------
Index descriptions
EMGB - ICE BofA Emerging Markets External Sovereign Index tracks the performance of US dollar and euro denominated emerging markets sovereign debt publicly issued in the major domestic and eurobond markets. Qualifying securities must have risk exposure to countries other than members of the FX-G10, all Western European countries and territories of the US and Western European countries.
EMCB - ICE BofA Emerging Markets Corporate Plus Index tracks the performance of the US dollar and euro denominated emerging markets non-sovereign debt publicly issued in the major domestic and eurobond markets. Qualifying issuers must have risk exposure to countries other than members of the FX G10, all Western European countries, and territories of the US and Western European countries.
EMIB - ICE BofA High Grade Emerging Markets Corporate Plus Index is a subset of the ICE BofA ML Emerging Markets Corporate Plus Index (EMCB) including all securities rated AAA through BBB3, inclusive.
EMHB - ICE BofA High Yield Emerging Markets Corporate Plus Index is a subset of the ICE BofA ML Emerging Markets Corporate Plus Index (EMCB) including all securities rated BB1 or lower.
Q690 - ICE BofA Custom Emerging Markets Short Duration Index tracks the performance of short-term US dollar and euro denominated emerging markets non-sovereign debt publicly issued in the major domestic and eurobond markets.
EMRA - ICE BofA Asia Emerging Markets Corporate Plus Index is the subset of the ICE BofAML Emerging Markets Corporate Plus Index, which includes only securities issued by countries associated with the region of Asia, excluding Kazakhstan, Kyrgyzstan, Tajikistan, Turkmenistan, and Uzbekistan.
EMHA – The ICE BofA High Yield Asia Emerging Markets Corporate Plus Index is a subset of ICE BofA Emerging Markets Corporate Plus Index including all securities rated BB1 and lower with a country of risk within the Asia region.
EMIA - The ICE BofA High Grade Asia Emerging Markets Corporate Plus Index is a subset of ICE BofA Emerging Markets Corporate Plus Index including all securities rated BBB3 and higher with a country of risk within the Asia region.
EMRL - ICE BofA Latin America Emerging Markets Corporate Plus Index is a subset of The ICE BofA Emerging Markets Corporate Plus Index including all securities issued by countries associated with the geographical region of Latin America.
EMIL - The ICE BofA High Grade Latin America Emerging Markets Corporate Index is a subset of ICE BofA Emerging Markets Corporate Plus Index including all securities rated BBB3 and higher with a country of risk within the Latin America region.
EMHL - ICE BofA High Yield Latin America Emerging Markets Corporate Plus is a subset of ICE BofA Emerging Markets Corporate Plus Index including all securities rated sub-investment grade based on the average of Moody's, S&P and Fitch, and with a country of risk associated with the geographical region of Latin America.
EMRE - ICE BofA EMEA Emerging Markets Corporate Plus Index is a subset of The ICE BofA Emerging Markets Corporate Plus Index including all securities issued by countries associated with the geographical region of Europe, the Middle East and Africa including Kazakhstan, Kyrgyzstan, Tajikistan, Turkmenistan and Uzbekistan.
EMIE - ICE BofA High Grade EMEA Emerging Markets Corporate Plus Index is a subset of ICE BofA Emerging Markets Corporate Plus Index including all securities rated BBB3 and higher with a country of risk within the Europe, Middle East and Africa regions.
EMHE - ICE BofA High Yield EMEA Emerging Markets Corporate Plus Index is a subset of ICE BofA Emerging Markets Corporate Plus Index including all securities rated BBB3 and higher with a country of risk within the Europe, Middle East and Africa regions.
The MSCI EM Index is a free-float weighted equity index that captures large and mid cap representation across emerging market countries. The index covers approximately 85% of the free float-adjusted market capitalisation in each country.
LDMP - ICE BofA Local Debt Markets Plus Index is designed to track the performance of emerging markets sovereign debt publicly issued and denominated in the issuer's own currency.
J0A0 - The ICE BofA ML US Cash Pay High Yield Index tracks the performance of US dollar denominated below investment grade corporate debt, currently in a coupon paying period that is publicly issued in the US domestic market.
C0A0 - The ICE BofA ML US Corporate Index tracks the performance of US dollar denominated investment grade corporate debt publicly issued in the US domestic market.
HE00 - The ICE BofA ML Euro High Yield Index tracks the performance of EUR dominated below investment grade corporate debt publicly issued in the euro domestic or eurobond markets.
ER00 – The ICE BofA ML Euro Corporate Index tracks the performance of EUR denominated investment grade corporate debt publicly issued in the eurobond or Euro member domestic markets.
ICE BofA High Yield Emerging Markets Corporate Plus India Issuers Index (EINH) - is a subset of ICE BofA Emerging Markets Corporate Plus Index including all securities with India as the country of risk that are rated sub-investment grade based on average of Moody's, S&P and Fitch
ADOL -The ICE BofA Asian Dollar Index tracks the performance of U.S. dollar denominated sovereign, quasi-government, corporate, securitized and collateralized debt publicly issued in the U.S. domestic and eurobond markets by Asian issuers.
ADHY - ICE BofA Asian Dollar High Yield Index tracks the performance of sub-investment grade U.S. dollar denominated sovereign, quasi-government, corporate, securitized and collateralized debt publicly issued in the U.S. domestic and eurobond markets by Asian issuers.
ADIG - ICE BofA Asian Dollar Investment Grade Index tracks the performance of investment grade U.S. dollar denominated sovereign, quasi-government, corporate, securitized and collateralized debt publicly issued in the U.S. domestic and eurobond markets by Asian issuers. Qualifying securities have a country of risk classified as an Emerging Markets country that is part of the Asia/Pacific Region.
CEMBI Broad Div. Index - The JP Morgan CEMBI Broad Diversified Index (CEMBIB Div) is a benchmark that tracks the performance of US dollar-denominated, fixed and floating-rate debt instruments issued by emerging market corporate entities.
JESG CEMBI Broad Div. Index - The JP Morgan ESG CEMBI Broad Diversified Custom Maturity Index tracks liquid, US Dollar denominated emerging market fixed and floating-rate debt instruments issued by corporates.
EM3B – ICE BofA BB Emerging Markets Corporate Plus Index is a subset of the ICE BofA Emerging Markets Corporate Plus Index including ass securities rated BB1 through BB3, inclusive.
EMCS – ICE BofA Emerging Markets Corporate Plus Consumer Index is a subset of ICE BofA Emerging Markets Corporate Plus Index including all securities of Consumer Cyclical and Consumer Non-Cyclical issuers.
EMEN – ICE BofA Emerging Market Corporate Plus Energy Index is a subset of ICE BofA Emerging Markets Corporate Plus Index including all securities of Energy issuers.
EMRB – ICE BofA Emerging Market Corporate plus Real Estate, Building & Hotels Index is a subset of ICE BofA Emerging Markets Corporate Plus Index including all securities of Real Easte, Building & Construction, or Hotels.
EMCG – ICE BofA Emerging Markets Corporate Plus Capital Goods Index is a subset of ICE BofA Emerging Markets Corporate Plus Index including all securities of Capital Goods Issuers.
EMSD – ICE BofA Emerging Markets Diversified Corporate Index tracks the performance of USD dollar denominated emerging markets corporate senior and secured debt publicly issued in the US domestic and eurobond markets.
EMTM – ICE BofA Emerging Markets Corporate Plus Media & Telecommunications Index is a subset of ICE BofA Emerging Markets Corporate Plus index including all securities of media and telecommunications issuers.
EM2B – ICE BofA BBB Emerging Markets Corporate Plus Index is a subset of the ICE BofA Emerging Market Corporate Plus index including all securities rated BBB1 through BBB3, inclusive.
EMUT – the ICE BofA Emerging Markets Corporate Plus Utility Index is a subset of the ICE BofA Emerging Markets Corporate Plus Index including all securities of Utility issuers.
EMPB – ICE BofA Public Sector Issuers Emerging Markets Corporate Plus Index is a subset of The BofA Emerging Markets Corporate Plus Index including all quasi-government securities as well as debt of corporate issuers deemed to be government owned or controlled.
ACIG – ICE BofA Asian Dollar Investment Grade Corporate Index tracks the performance of investment grade US dollar denominated securities issued by Asian corporate issuers in the US domestic and eurobonds market. Qualyfying securities have a country of risk associated with Bangladesh, Bhutan, Cambodia, China, John Kong, India, Indonesia, Laos, Macau, Malaysia, Mongolia, Myanmar, Nepal, Pakistan, Papua New Guinea, Philippines, Singapore, South Korea, Sri Lanka, Taiwan, Thailand and Vietnam.
EMAB – Ice BofA Automotive & Basic Industry Emerging Markets Corporate Plus Index is a subset of the ICE BofA Emerging Markets Corporate Plus Index.
EMHE - The ICE BofA High Yield EMEA Emerging Markets Corporate Plus Index is a subset of ICE BofA Emerging Markets Corporate Plus Index including all securities rated BBB3 and higher with a country of risk within the Europe, Middle East and Africa regions.
EMNS – The ICE BofA Non-Financial Emerging Markets Corporate Plus Index is a subset of the ICE BofA Emerging Markets Corporate Plus Index excluding all financial securities as well as debt of corporate issuers designated as government owned or controlled by ICE BofA emerging markets credit research.
EM1B – the ICE BofA AAA-A Emerging Markets Corporate Plus Index is a subset of the ICE BofA Emerging Market Corporate Plus Index including all securities rated AAA through A3, inclusive.
EMFN – EM Corporate Plus Financial is a subset of ICE BofA Emerging Markets Corporate Plus Index including all securities of financial issuers.
EMIE - The ICE BofA High Grade EMEA Emerging Markets Corporate Plus Index is a subset of ICE BofA Emerging Markets Corporate Plus Index including all securities rated BBB3 and higher with a country of risk within the Europe, Middle East and Africa regions.
EM4B – ICE BofA B & Lower Emerging Markets Corporate Plus Index is a subset of the ICE BofA Emerging Markets Corporate Plus Index.
EMRT – ICE BofA Emerging Markets Corporate Plus Transportation Index is a subset of ICE BofA Emerging Markets Corporate Plus Index including all securities of Transportation issuers other than airlines or railroads.
You cannot invest directly in an index, which also does not take into account trading commissions or costs. Additionally, indices do not include reinvestment of dividends, and the volatility of indices may be materially different over time.
Important information
Muzinich and/or Muzinich & Co. referenced herein is defined as Muzinich & Co., Inc. and its affiliates. Muzinich views and opinions. This material has been produced for information purposes only and as such the views contained herein are not to be taken as investment advice. Opinions are as of date of publication and are subject to change without reference or notification to you. Past performance is not a reliable indicator of current or future results and should not be the sole factor of consideration when selecting a product or strategy. The value of investments and the income from them may fall as well as rise and is not guaranteed and investors may not get back the full amount invested. Rates of exchange may cause the value of investments to rise or fall.
Any research in this document has been obtained and may have been acted on by Muzinich for its own purpose. The results of such research are being made available for information purposes and no assurances are made as to their accuracy. Opinions and statements of financial market trends that are based on market conditions constitute our judgment and this judgment may prove to be wrong. The views and opinions expressed should not be construed as an offer to buy or sell or invitation to engage in any investment activity, they are for information purposes only.
This discussion material contains forward-looking statements, which give current expectations of future activities and future performance. Any or all forward-looking statements in this material may turn out to be incorrect. They can be affected by inaccurate assumptions or by known or unknown risks and uncertainties. Although the assumptions underlying the forward-looking statements contained herein are believed to be reasonable, any of the assumptions could be inaccurate and, therefore, there can be no assurances that the forward-looking statements included in this discussion material will prove to be accurate. In light of the significant uncertainties inherent in the forward-looking statements included herein, the inclusion of such information should not be regarded as a representation that the objectives and plans discussed herein will be achieved. Further, no person undertakes any obligation to revise such forward-looking statements to reflect events or circumstances after the date hereof or to reflect the occurrence of unanticipated events.
United States: This material is for Institutional Investor use only – not for retail distribution. Muzinich & Co., Inc. is a registered investment adviser with the Securities and Exchange Commission (SEC). Muzinich & Co., Inc.’s being a Registered Investment Adviser with the SEC in no way shall imply a certain level of skill or training or any authorization or approval by the SEC.
Issued in the European Union by Muzinich & Co. (Ireland) Limited, which is authorized and regulated by the Central Bank of Ireland. Registered in Ireland, Company Registration No. 307511. Registered address: 32 Molesworth Street, Dublin 2, D02 Y512, Ireland. Issued in Switzerland by Muzinich & Co. (Switzerland) AG. Registered in Switzerland No. CHE-389.422.108. Registered address: Tödistrasse 5, 8002 Zurich, Switzerland. Issued in Singapore and Hong Kong by Muzinich & Co. (Singapore) Pte. Limited, which is licensed and regulated by the Monetary Authority of Singapore. Registered in Singapore No. 201624477K. Registered address: 6 Battery Road, #26-05, Singapore, 049909. Issued in all other jurisdictions (excluding the U.S.) by Muzinich & Co. Limited. which is authorized and regulated by the Financial Conduct Authority. Registered in England and Wales No. 3852444. Registered address: 8 Hanover Street, London W1S 1YQ, United Kingdom. 2025-09-04-16872

By clicking "Submit", I am (i) signing up to receive the Opinion Pieces from the "Opinions" page of the Muzinich & Co website, (ii) representing that the above information is true and accurate and (iii) agreeing to join the Muzinich & Co mailing list. I understand that Muzinich & Co will not add retail investors or individuals with personal email addresses to its mailing list and represent that I am not a retail investor. By providing my personal and professional information I am consenting to its use and disclosure in accordance with the Muzinich & Co. Privacy Policy. I understand that I may withdraw my consent and unsubscribe from receiving future communications by clicking "Unsubscribe" from the emails that are sent to me from Muzinich & Co.