Asia Credit: An underappreciated opportunity
EM Monthly
September 7, 2026
If you have any feedback on this article or are interested in subscribing to our content, please contact us at opinions@muzinich.com or fill out the form on the right hand side of this page.
--------
Asia credit combines the growth potential of emerging markets with the quality characteristics of developed markets. Supported by resilient fundamentals, favourable technicals and powerful structural trends, the asset class offers a compelling opportunity for investors seeking diversification, income and long-term capital preservation explains Mel Siew.
Asia credit has quietly become one of the most compelling areas within global fixed income. The asset class combines exposure to key emerging sectors in the world's fastest-growing region with a predominantly investment-grade universe, strong domestic investor support and attractive long-term structural growth drivers.
Yet despite these strengths, many international investors remain under allocated. Lingering concerns around China, misconceptions about valuation and a lack of familiarity with the asset class have contributed to a persistent allocation gap.
In our view, the combination of improving fundamentals, supportive technicals and the potential for attractive risk-adjusted returns creates a compelling case for investors to think again about an allocation.
The best of emerging and developed markets
Asian credit occupies a distinctive position between developed and emerging market fixed income. It combines relatively high credit quality with stronger structural growth and a deep domestic investor base, which helps provide resilience during periods of market volatility.
The region includes highly rated sovereigns, including Singapore (AAA), Australia (AAA), Hong Kong (AA+), South Korea (AA) and Taiwan (AA), alongside single-A rated Japan, China and Malaysia.
For corporate investors, these strong sovereign balance sheets help underpin stable policy frameworks, well-developed domestic capital markets and favourable funding conditions, providing a supportive backdrop for corporate balance sheets and long-term credit quality.
"With around 85–90% of the market rated investment grade, investors benefit from a combination of high average credit quality, resilient corporate fundamentals and an increasingly diverse opportunity set."
The Caste for Asia Credit - A strengthening macro backdrop
The backdrop for Asian credit has also strengthened considerably over the past 12 to 18 months. Asia remains the fastest-growing region of the global economy; India is forecast by the IMF to grow by around 6.5% in 2026, with Indonesia expected to expand by around 5% and the Philippines by approximately 4%.1 Their economies are being supported by resilient domestic demand, infrastructure investment, technological innovation and favourable demographics.
Even in slower-growing markets such as Thailand, investment in advanced manufacturing and supply-chain diversification continues to support corporate earnings and credit fundamentals. Recent rating actions have reinforced the region's resilience. Moody's revised China's sovereign outlook from Negative to Stable, while Thailand's outlook has also returned to Stable following an easing in downside risks, reflecting improving confidence in the region's economic outlook.2
Investor sentiment has also improved. Confidence in China's growth outlook has improved as policy support has increased and the economy has shown greater resilience than many investors expected, despite ongoing weakness in the property sector.3
Asian equity markets have strengthened and sectors such as semiconductors continue to benefit from the global expansion of artificial intelligence. At the same time, the region has remained comparatively insulated from many of the geopolitical challenges affecting Europe and parts of the Middle East, supporting investment and economic activity.
Technical factors provide an additional tailwind. The Asian credit market is now in its fifth consecutive year of negative net supply, as many companies continue to rely on bank financing and local currency capital markets, rather than international, largely US dollar denominated, capital markets.
Limited issuance, combined with robust investor demand and renewed allocations from global investors, has supported spreads and created a favourable technical backdrop.

Source: International Monetary Fund, World Economic Outlook, as of April 2026. Forecasts are not a reliable indicator of future results.
"Looking further ahead, the gradual shift from bank lending to bond financing should deepen and diversify the regional corporate credit market, broadening the investment opportunity set while supporting its long-term development."
Where we see value
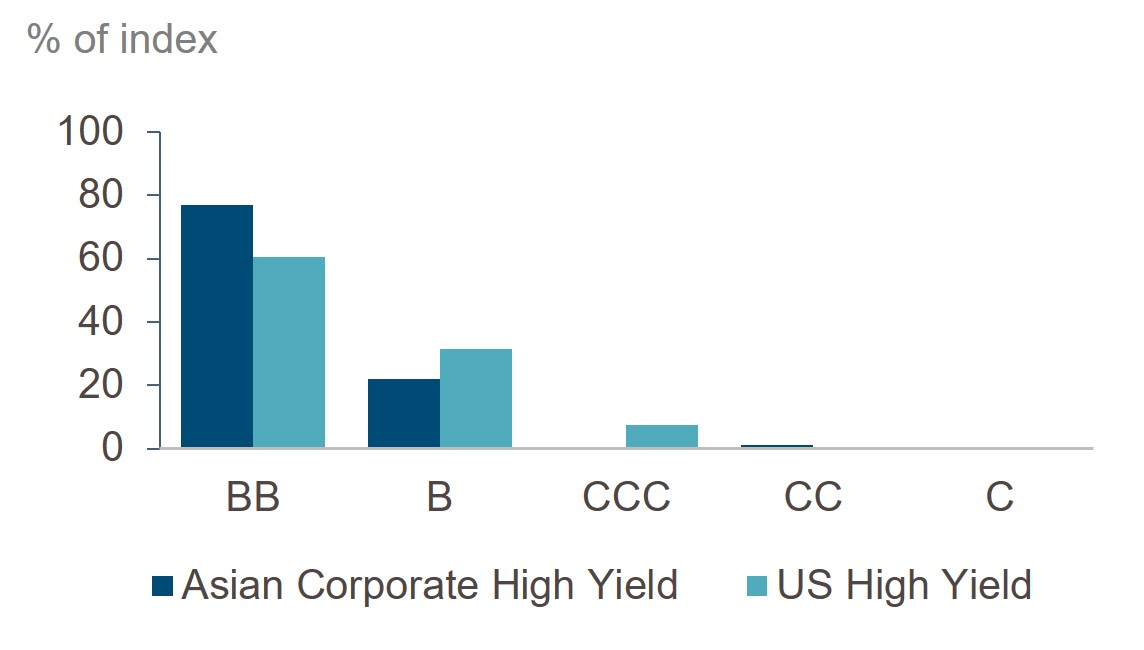
We also believe Asian high yield compares favourably with developed market high yield from a risk-reward perspective. Approximately three-quarters of the Asian corporate high-yield universe is rated BB, compared with a significantly lower proportion in developed market high-yield indices (Figure 1).
Investors therefore gain exposure to a higher-quality segment of the market while still benefiting from attractive spreads.
Figure 1: Higher credit quality in Asia HY
Indian renewables
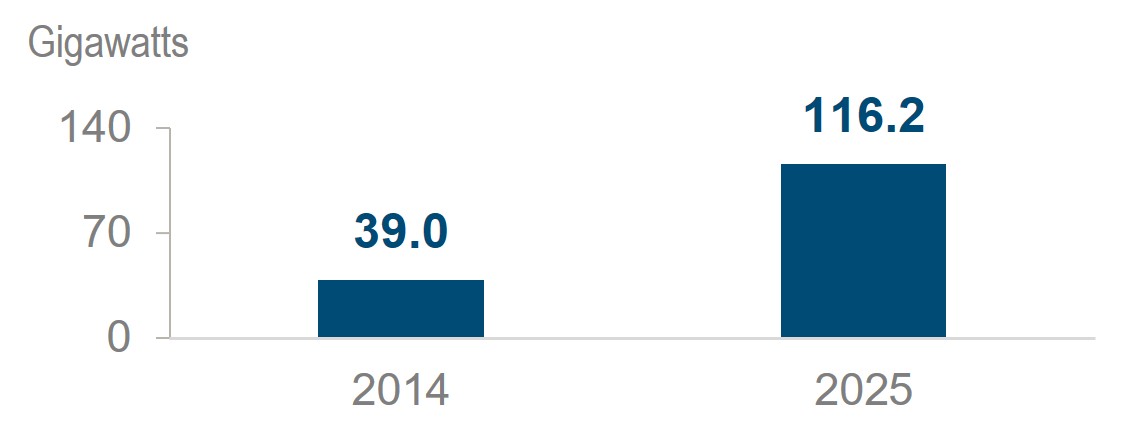
Indian BB-rated credits look especially compelling, accounting for c.70% of the Indian high-yield universe and offering attractive relative value. The renewable energy sector is particularly interesting having matured rapidly (up nearly 200% in terms of generation capacity in the last decade – Figure 2), evolving from a pure power generation industry into a diversified infrastructure ecosystem encompassing energy storage, round-the-clock power solutions and domestic manufacturing.
This evolution has made it one of the most attractive structural growth opportunities within Asian credit. Importantly for active investors, despite benefiting from long-term contracted cash flows, supportive government policy and strong structural demand, many Indian renewable issuers continue to be rated BB, creating opportunities to access resilient infrastructure-backed businesses at attractive spreads.
Figure 2: India's solar capacity growth nearly tripled in 10 years
Hong Kong investment grade
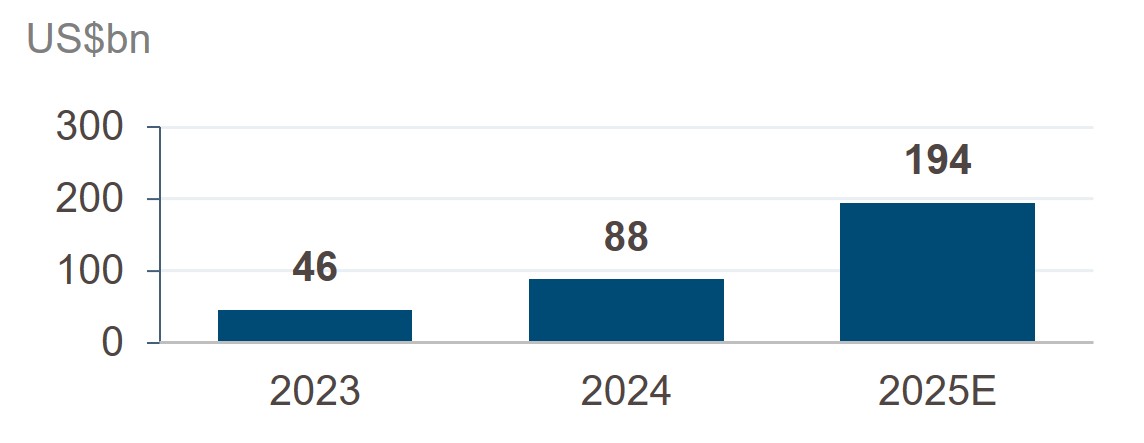
Within investment grade, Hong Kong's BBB-rated issuers present an attractive opportunity as improving fundamentals are not yet fully reflected in valuations. Economic activity has strengthened, residential property markets have stabilised and IPO activity has begun to recover (Figure 3), supporting broader business confidence.
The territory's close economic ties with mainland China also position it to benefit from any further improvement in Chinese growth and investor sentiment.Meanwhile, sectors such as insurance continue to perform strongly, supported by higher interest rates, healthy capital generation and renewed demand from mainland Chinese customers.
In our view, this combination of improving macroeconomic conditions, resilient corporate fundamentals and attractive spreads creates a compelling opportunity for active credit investors.
Figure 3: IPO proceeds increased by >4x
Sources: ICE Index Platform, as of 30 June 2026. ICE BofA Asian Dollar High Yield Corporate Index (ACHY), ICE BofA US High Yield Corporate Index (J0A0) (Figure 1). India Energy & Environment, Powering Atmanirbhar Bharat, as of 15 August 2025 (Figure 2). KPMG, as of 10 December 2025, Chinese Mainland and Hong Kong IPO Markets report 2025 review and 2026 outlook; 2025 number is an estimate, latest available data used (Figure 3). Index performance is for illustrative purposes only. You cannot invest directly in an index.
"Indian renewables have evolved from pure power generation into a diversified infrastructure ecosystem — a structural growth opportunity still largely rated BB.
Improving Hong Kong fundamentals are not yet fully reflected in BBB valuations — in our view a compelling opportunity for active credit investors."
Powerful structural tailwinds
Several powerful structural trends continue to underpin the long-term outlook for Asian credit.
The first is supply chain diversification. As companies seek greater resilience, the “China Plus One” strategy has encouraged investment across a broader range of Asian economies.
While China remains central to many global supply chains, incremental manufacturing capacity is increasingly being built elsewhere in the region (Apple now makes around a quarter of its iPhones in India for example4), supporting foreign direct investment, capital expenditure and financing needs.
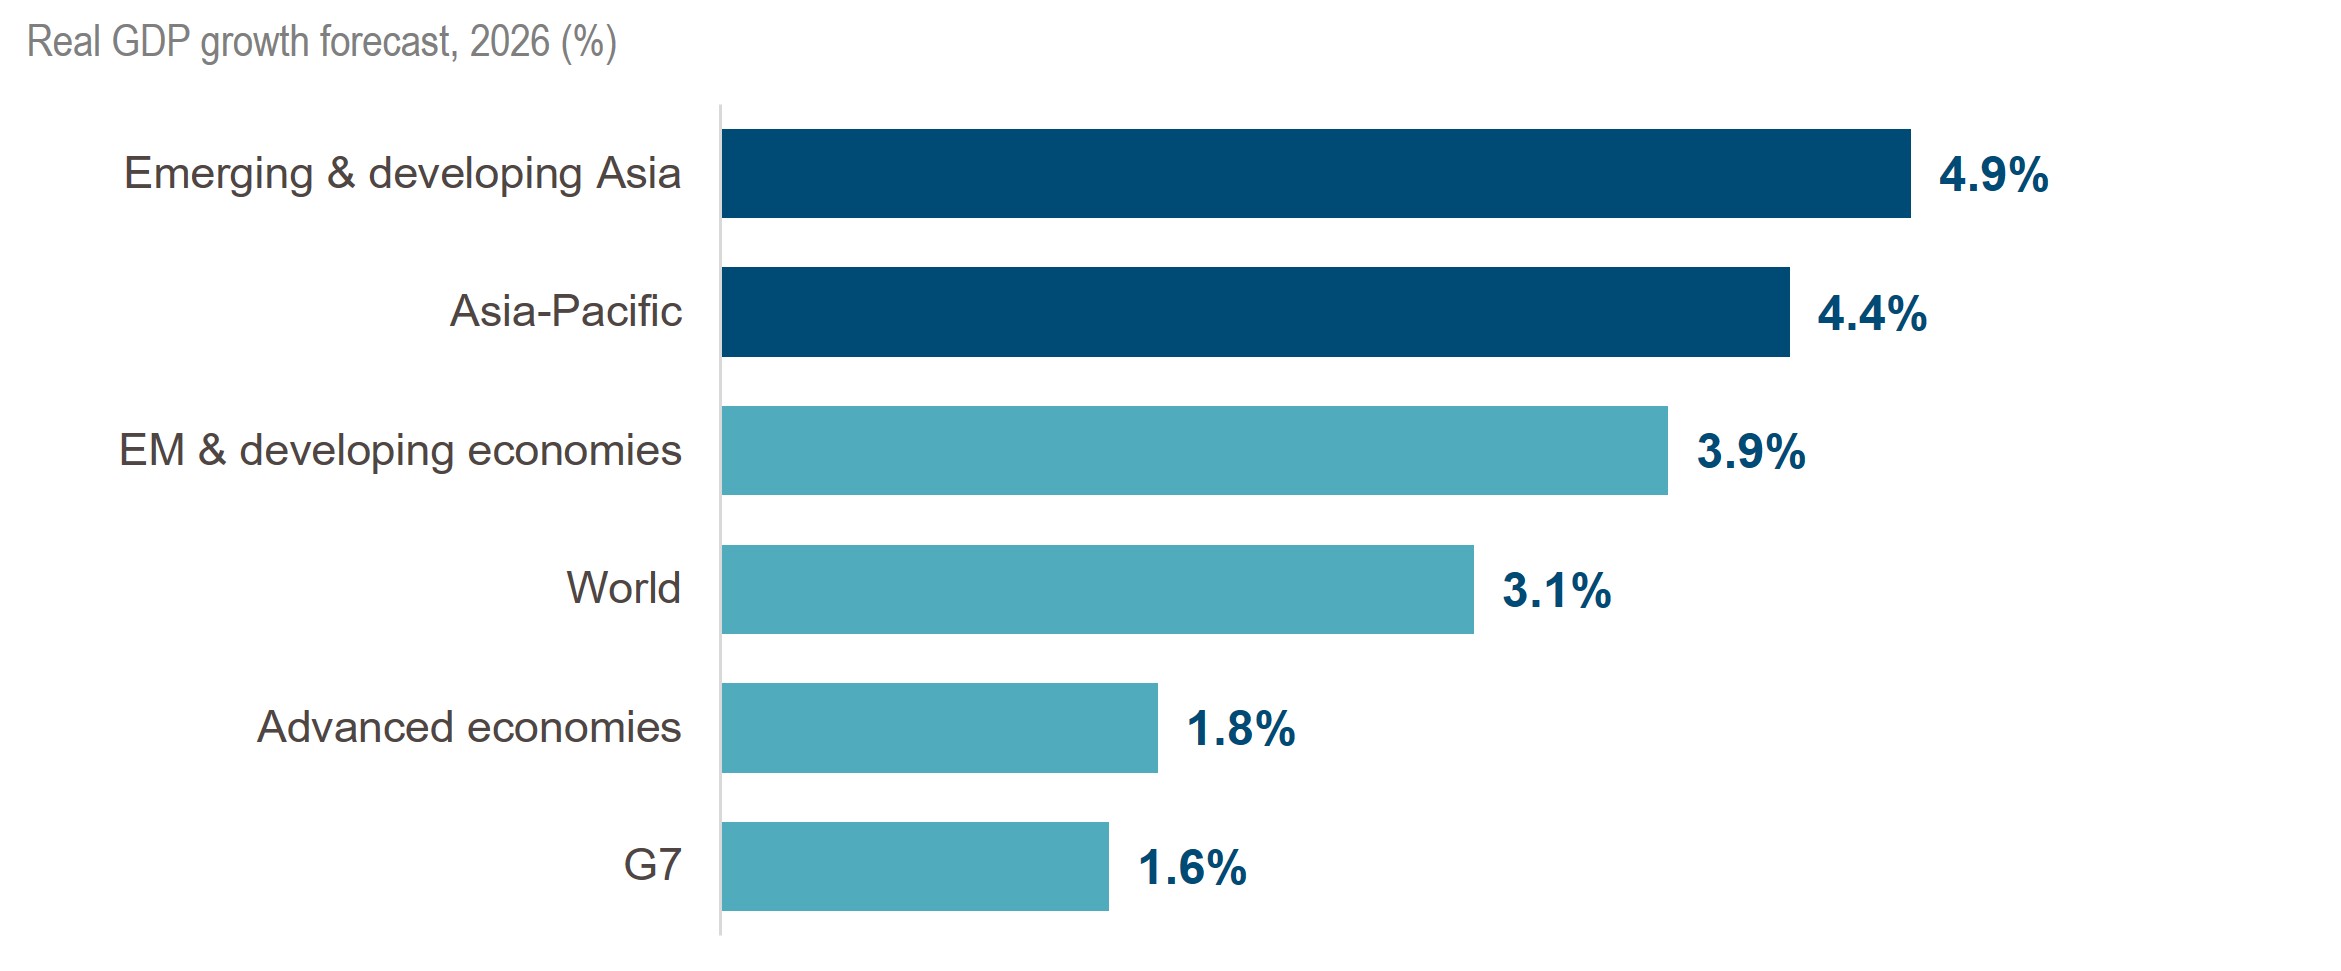
Second, Asia remains the primary engine of global economic growth (Figure 4). India continues to expand rapidly, China remains focused on supporting growth and Japan has re-emerged as a source of economic momentum. This creates a favourable environment for both corporate issuance and investor demand.
Third, Asia sits at the centre of several major investment themes, including artificial intelligence, semiconductors, digital infrastructure and the energy transition. Many of the technologies and supply chains supporting these trends are concentrated in the region.
Finally, Asia's infrastructure build-out presents a significant sustainable finance opportunity. Across much of the region, governments are investing heavily in new energy, transport and digital infrastructure, creating an opportunity to embed low-carbon technologies, climate resilience and higher environmental standards into projects from the outset.
References to specific companies is for illustrative purposes only and does not reflect the holdings of any specific past or current portfolio or account.
Figure 4: Asia is the dominant driver of global growth
Source: International Monetary Fund, World Economic Outlook, as of April 2026. Real GDP growth forecast for 2026. Forecasts are not a reliable indicator of future results.
As the OECD highlights, aligning infrastructure investment with sustainability objectives not only supports long-term economic development but also helps attract growing pools of green and sustainable capital.5
Risks and considerations
No investment opportunity is without risk, and Asian credit is no exception.
Many Asian economies remain significant importers of energy and refined petroleum products, leaving them exposed to supply disruptions and sustained increases in energy prices. The recent US-Iran conflict has reinforced or strengthened the strategic case for energy security.6
Meanwhile China-specific risks are worth consideration. While sentiment has improved, investors continue to monitor the property sector, policy developments and the broader growth outlook. Nevertheless, these challenges should be viewed alongside China's structural strengths, including deep domestic capital markets, a globally competitive industrial base and policymakers' capacity to support economic stability when required.
Then there are geopolitical tensions. US-China relations and regional security issues remain important, but Asia is far from a homogeneous market. Its diversity across countries, sectors and issuers offers active investors the benefits of diversification and to identify companies with resilient fundamentals, limiting direct exposure to potential flashpoints.
More broadly, the resilience of the asset class should not be overlooked. Inflation has remained comparatively well contained across much of Asia (Figure 5), providing many central banks with greater flexibility than their developed market counterparts while supporting macroeconomic stability.
While inflation remains subdued in several North Asian economies, reflecting softer domestic demand and more moderate price pressures, somewhat higher inflation in faster-growing markets such as India and the Philippines is primarily driven by resilient domestic consumption, infrastructure investment and stronger economic growth rather than overheating or broad-based inflationary pressures.
Figure 5: Inflation remains comparatively contained across Asia
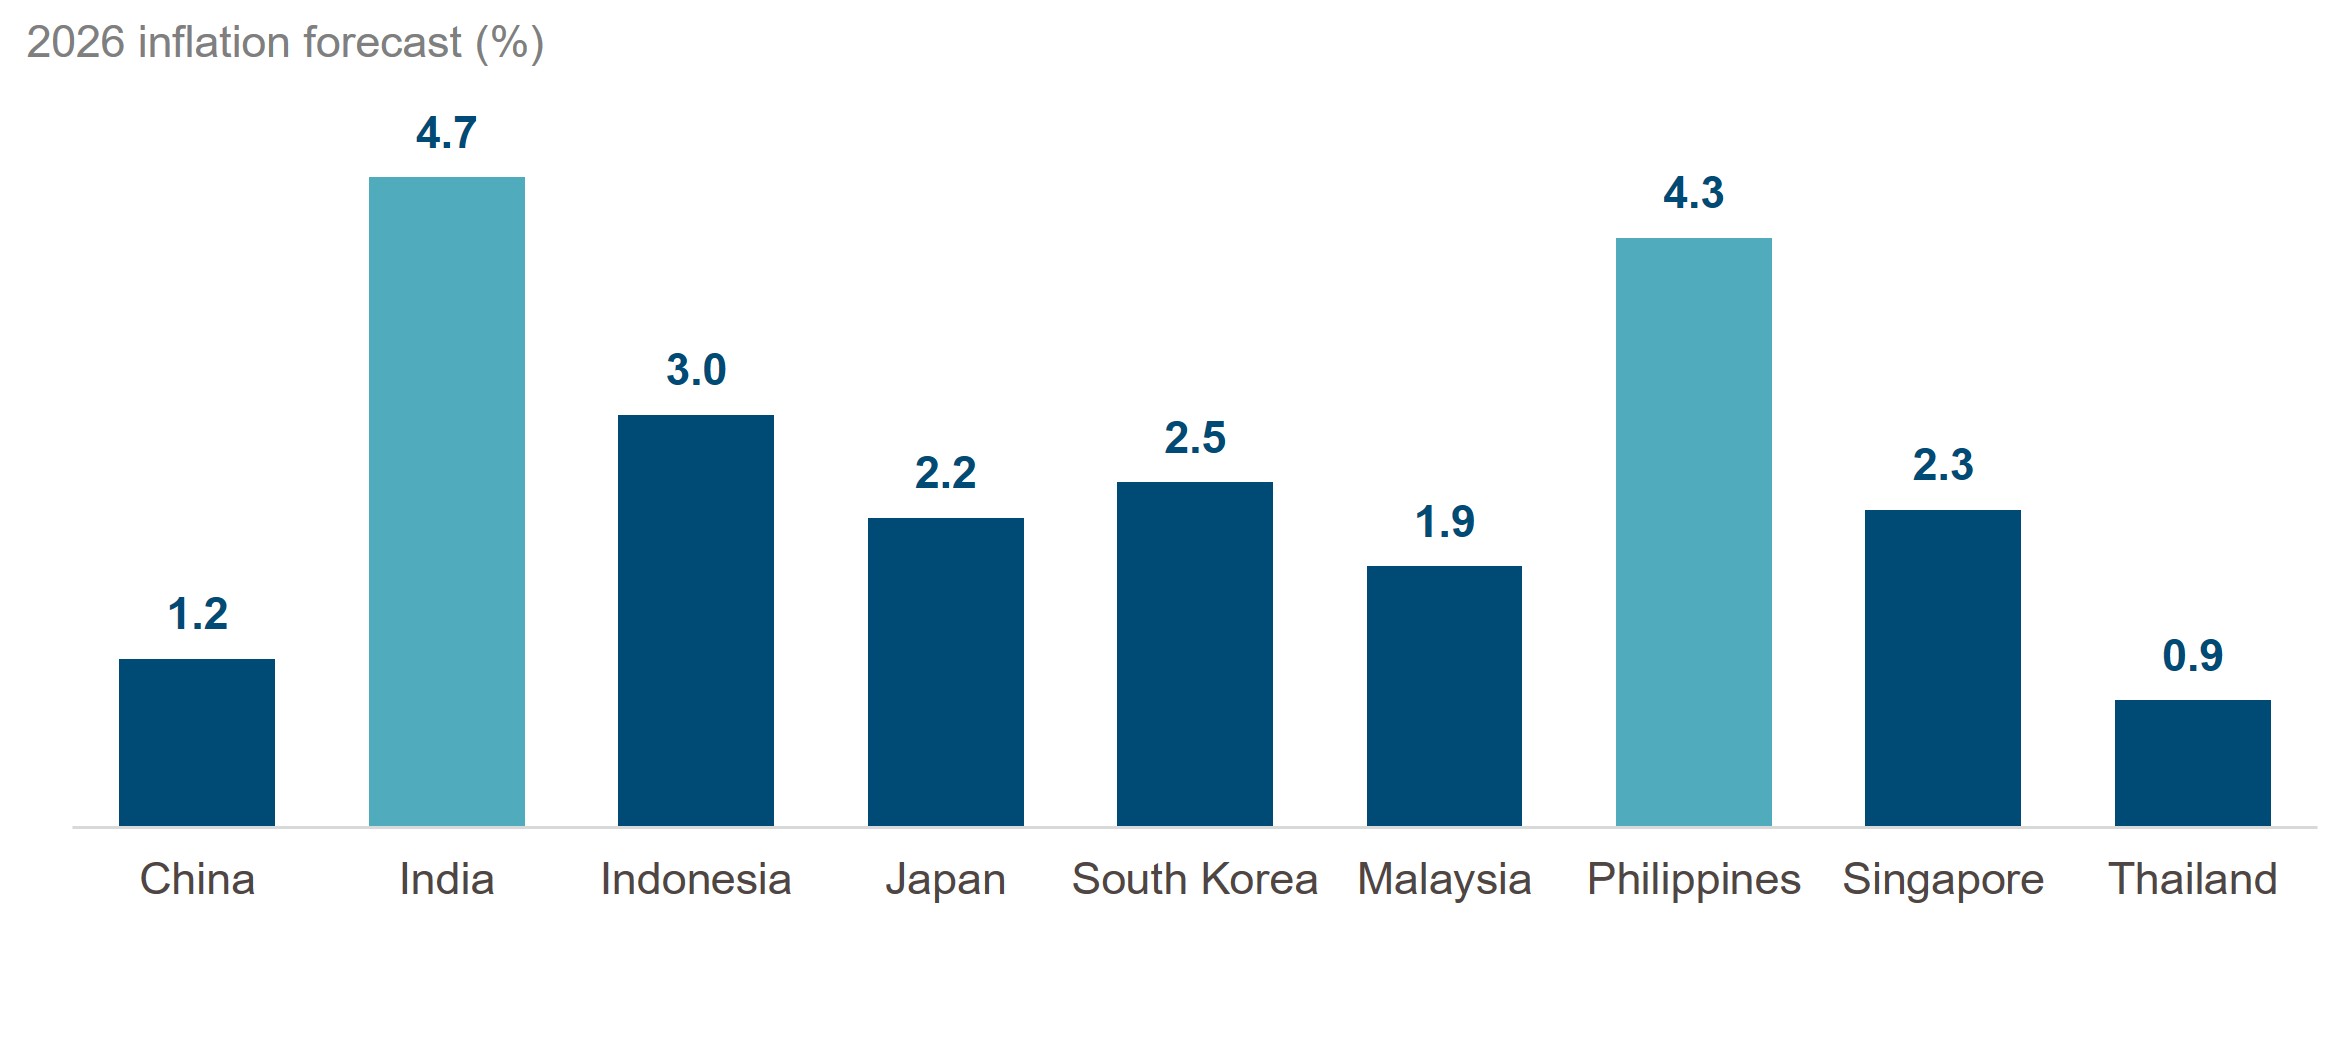
Source: IMF World Economic Outlook Database, official IMF world inflation forecasts, as of April 2026. Latest available data used. For illustrative purposes only. Forecasts are not a reliable indicator of future results.
Together with generally prudent fiscal positions and a corporate credit market dominated by high-quality issuers, this has helped underpin the resilience of Asian corporate credit through periods of global uncertainty.
The role of Asia credit in portfolios
Asian credit has evolved into a mature and diverse asset class that we believe merits consideration as a core component of global fixed income portfolios rather than a niche allocation. With around 85–90% of the market rated investment grade, investors benefit from a combination of high average credit quality, resilient corporate fundamentals and an increasingly diverse opportunity set across countries, sectors and issuers.
Asia IG has demonstrated its resilience through periods of global volatility in both 2025 and 2026. Strong regional macroeconomic fundamentals have been complemented by supportive market technicals, including deep domestic investor bases, relatively constrained net supply and improving market liquidity. Together, these characteristics have helped Asian IG withstand periods of volatility and reinforce its credentials as a source of diversification and risk-adjusted returns.
We believe this evolution supports a broader role for the asset class. Rather than viewing Asian IG simply as a satellite emerging-market exposure, investors could increasingly consider it as a credible regional allocation alongside US and European investment grade.
The historical risk-adjusted return profile of the market, as illustrated by the Sharpe ratio comparison, provides further support for this argument.
This resilient investment-grade foundation can then provide a platform from which active investors seek incremental returns. Asia high yield broadens the opportunity set, providing exposure to a diverse range of countries, sectors and issuers where we continue to identify attractive bottom-up opportunities. Selective exposure to HY can therefore complement the stability and quality of an IG allocation while potentially enhancing income and total returns.
The longer-term investment case extends beyond today's attractive valuations and supportive technical backdrop. Asia remains a major driver of global economic growth, while structural trends are creating significant opportunities across the corporate credit market. Supply-chain diversification, the rapid expansion of artificial intelligence and digital infrastructure, the energy transition and the continued development of regional capital markets are generating substantial financing requirements that should support both issuance opportunities and corporate earnings for years to come. These trends are also broadening the market beyond some of the sectors and countries with which Asian credit has traditionally been associated. Combined with deepening domestic capital markets and an increasingly sophisticated regional investor base, this should further enhance the breadth, liquidity and resilience of the asset class over time.
Despite these strengths, many global investors remain under allocated to Asian credit, often reflecting outdated perceptions shaped by previous concerns over China rather than the broader evolution of the market. In our view, this creates a disconnect between investor allocations and the quality, diversity and economic importance of the opportunity set available today.
As Asia continues to strengthen its position as a principal engine of global economic growth, we believe its credit markets deserve a correspondingly greater role in global fixed income portfolios. Asia IG can provide a resilient core regional allocation, while selective exposure to Asia HY offers the potential to generate incremental return.
Together, they offer a combination of quality, diversification, income and exposure to powerful long-term structural growth trends that we believe is increasingly difficult to replicate elsewhere in global fixed income.
Figure 6: Asia IG delivers stronger risk-adjusted returns
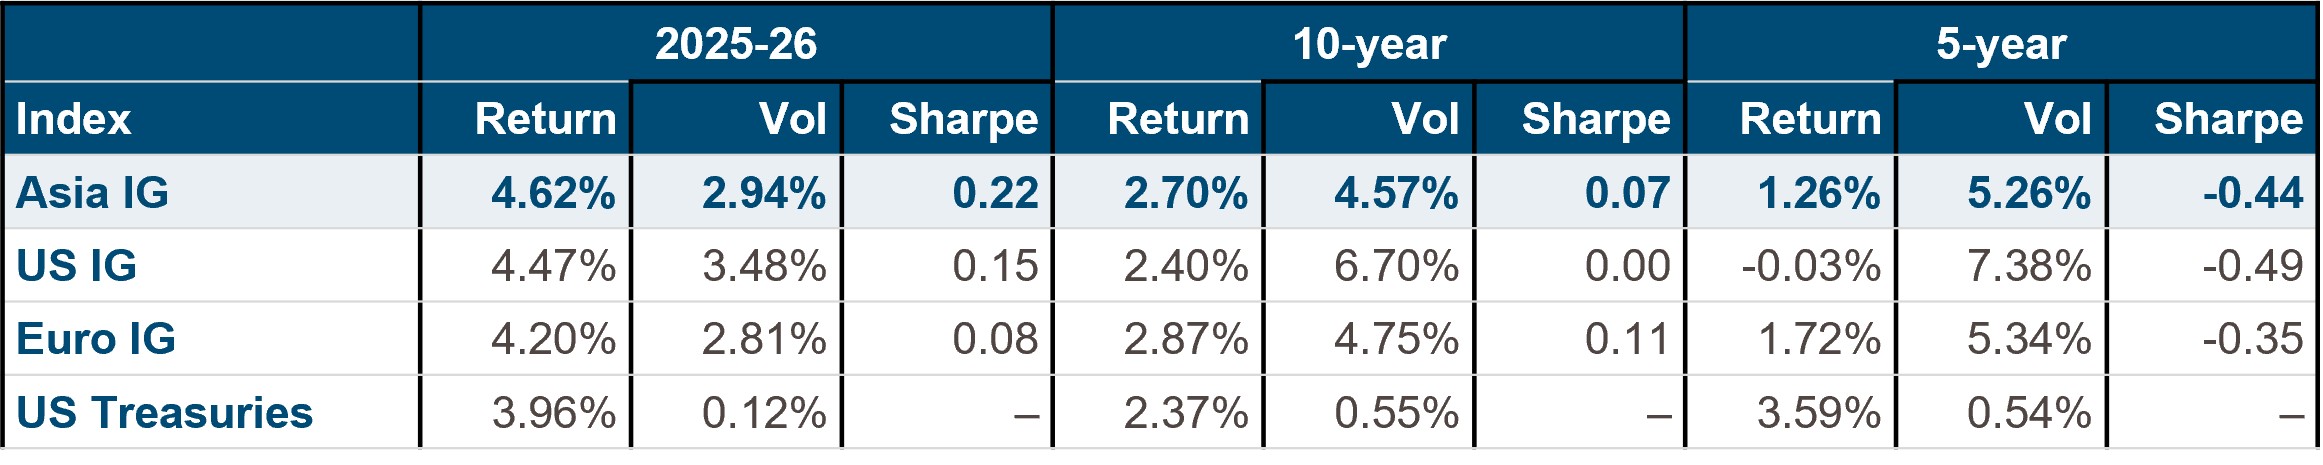
Past performance: Past performance is not a reliable indicator of current or future results and should not be the sole factor of consideration when selecting a product or strategy.
Source: ICE Index Platform, as of 31 July 2026. Asia IG - ICE BofA Asian Dollar Investment Grade Index (ADIG); US IG - ICE BofA US Corporate Index (C0A0); Euro IG - ICE BofA Euro Corporate Index (ER00); US Treasury- ICE BofA US Treasury Bill Index (G0O1). For illustrative purposes only. You cannot invest directly in an index.
EM look back – August
Past performance is not a reliable indicator of current or future results.
Market Data - Credit
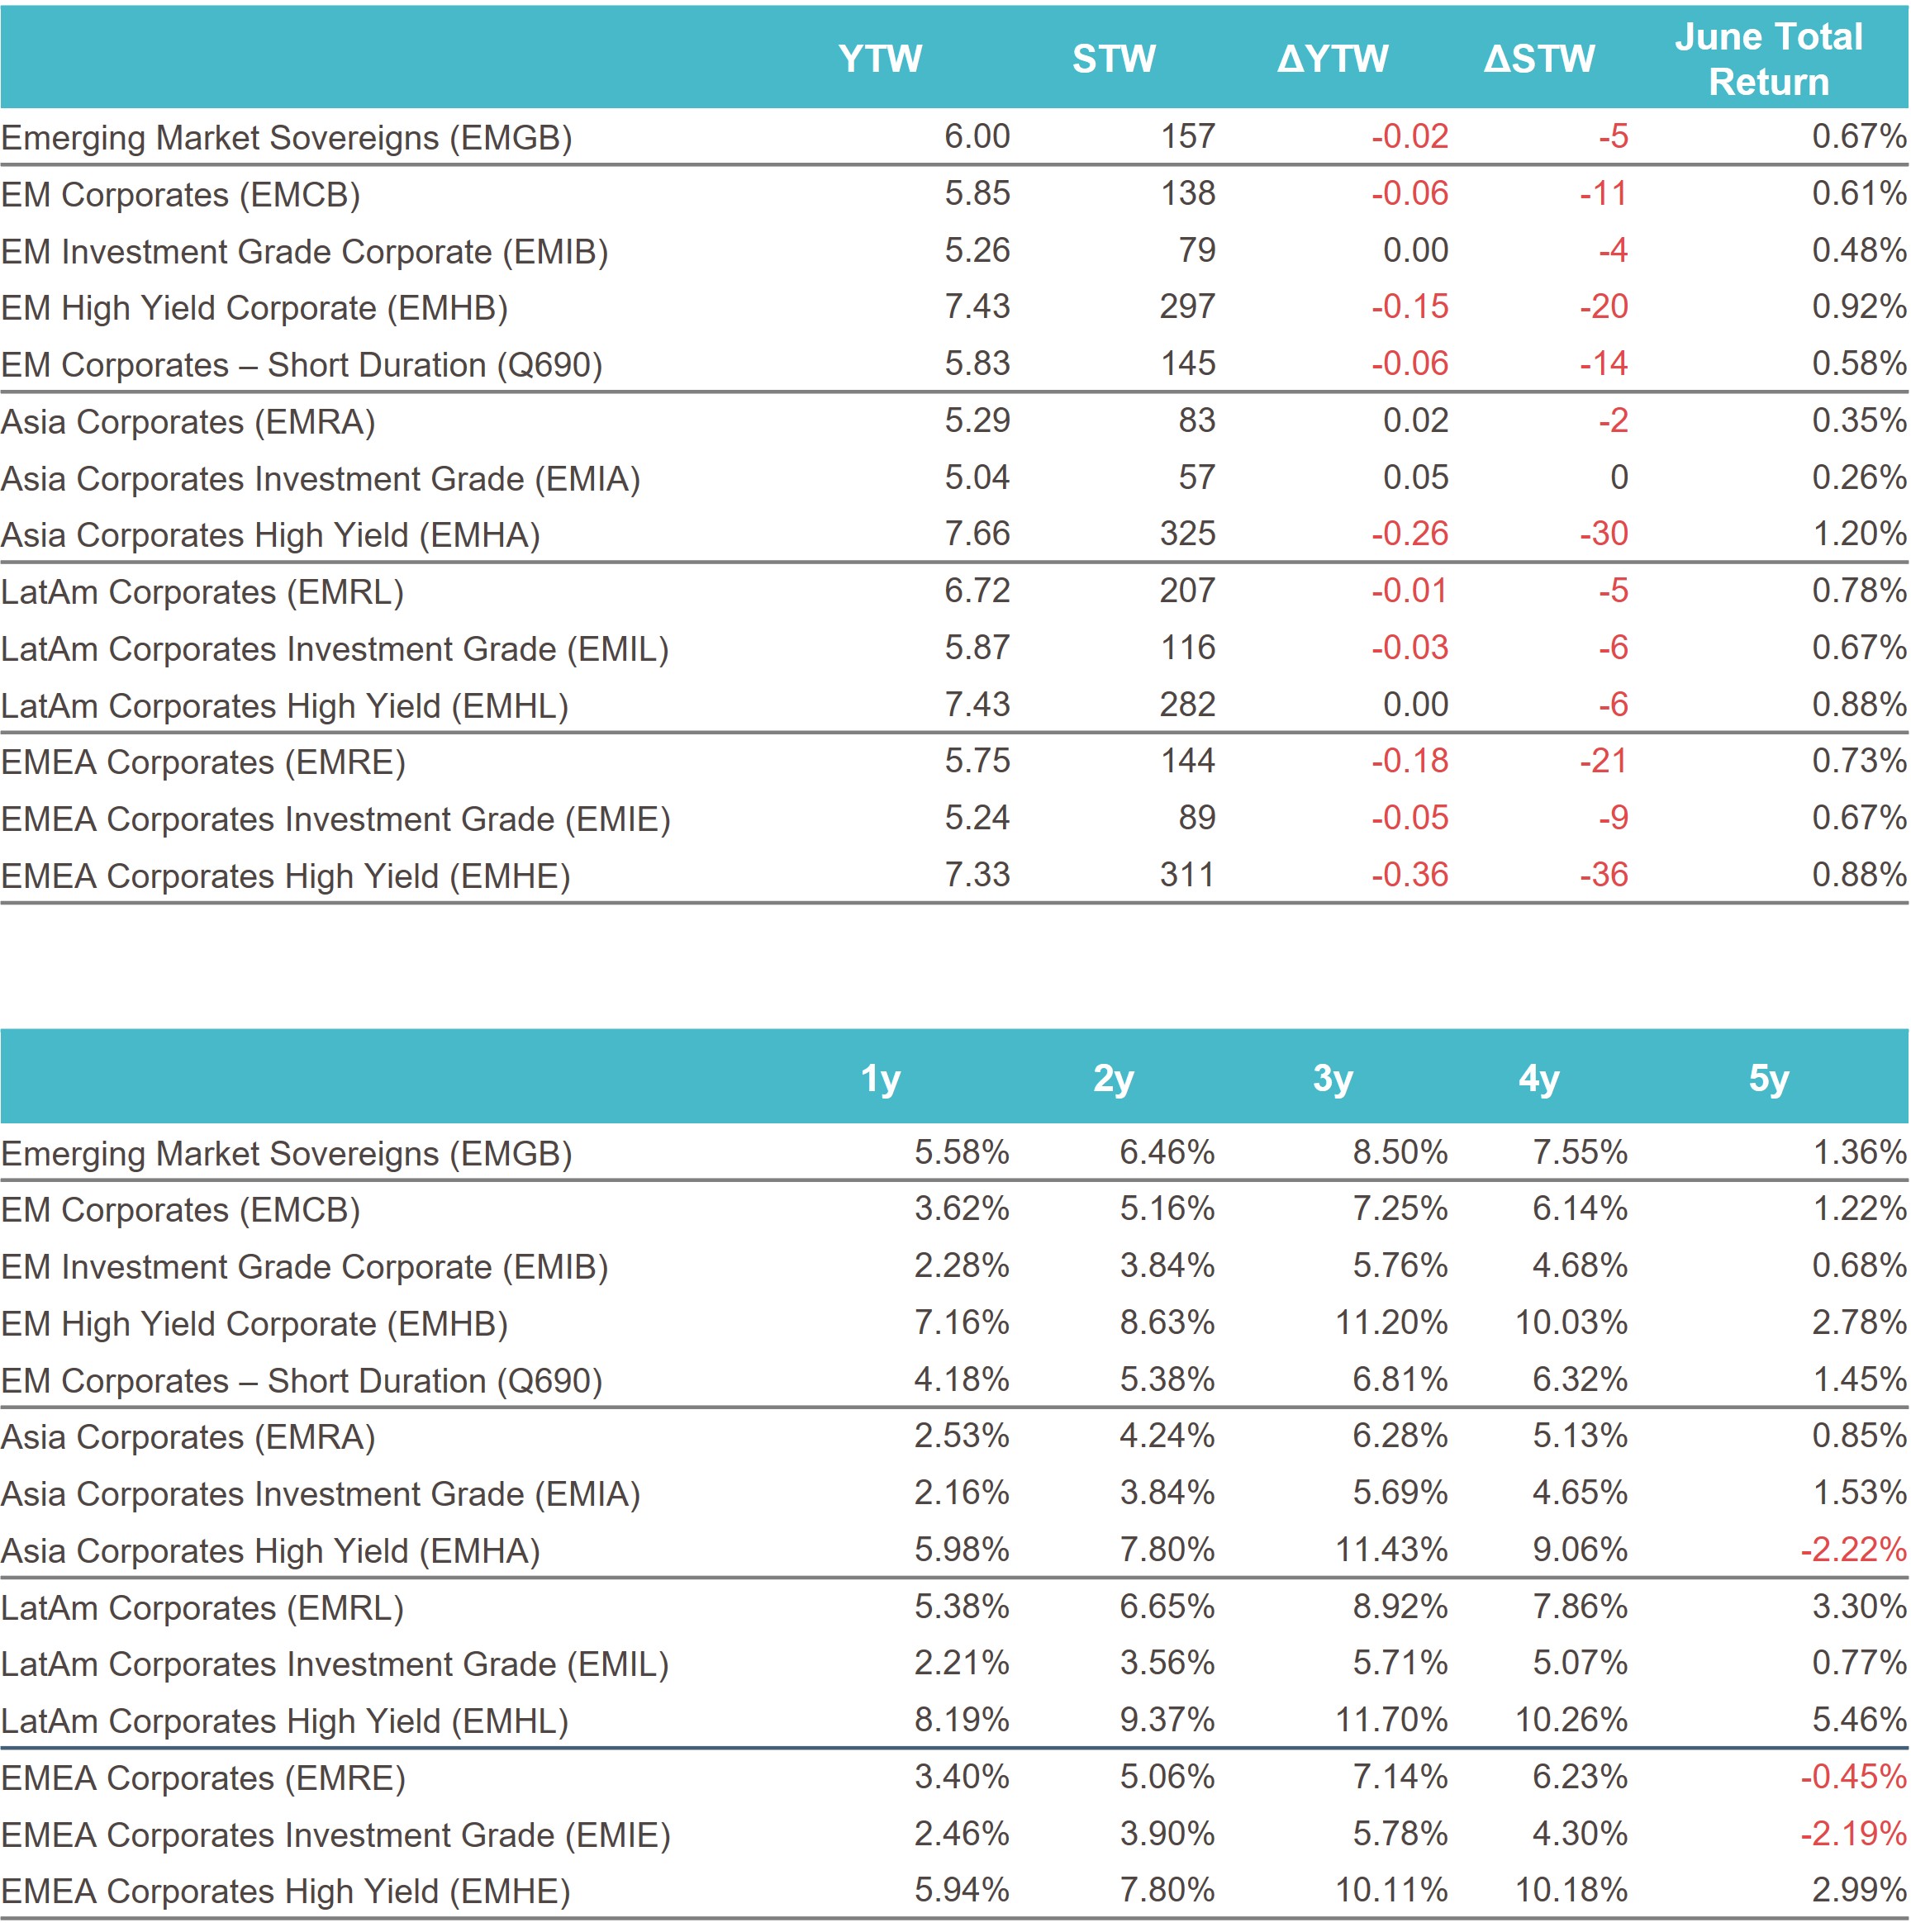
Past performance is not a reliable indicator of current or future results.
Source: ICE data platform. as of 31st August 2026. EMGB - ICE BofA Emerging Markets External Sovereign Index EMCB - ICE BofA Emerging Markets Corporate Plus Index, EMIB - ICE BofA High Grade Emerging Markets Corporate Plus Index, EMHB - ICE BofA High Yield Emerging Markets Corporate Plus Index, Q690 - ICE BofA Custom Emerging Markets Short Duration Index, EMRA - ICE BofA Asia Emerging Markets Corporate Plus Index, EMIA - ICE BofA High Grade Asia Emerging Markets Corporate Plus Index, EMHA - ICE BofA High Yield Asia Emerging Markets Corporate Plus Index , EMRL - ICE BofA Latin America Emerging Markets Corporate Plus Index, EMIL - The ICE BofA High Grade Latin America Emerging Markets Corporate Index, EMHL - ICE BofA High Yield Latin America Emerging Markets Corporate Plus, EMRE - ICE BofA EMEA Emerging Markets Corporate Plus Index, EMIE - ICE BofA High Grade EMEA Emerging Markets Corporate Plus Index, EMHE - ICE BofA High Yield EMEA Emerging Markets Corporate Plus Index,. Index performance is for illustrative purposes only. You cannot invest directly in the index. Indices selected provide best proxy for highlighting performance of emerging market corporate bonds. For illustrative purposes only.
Yield to Worst
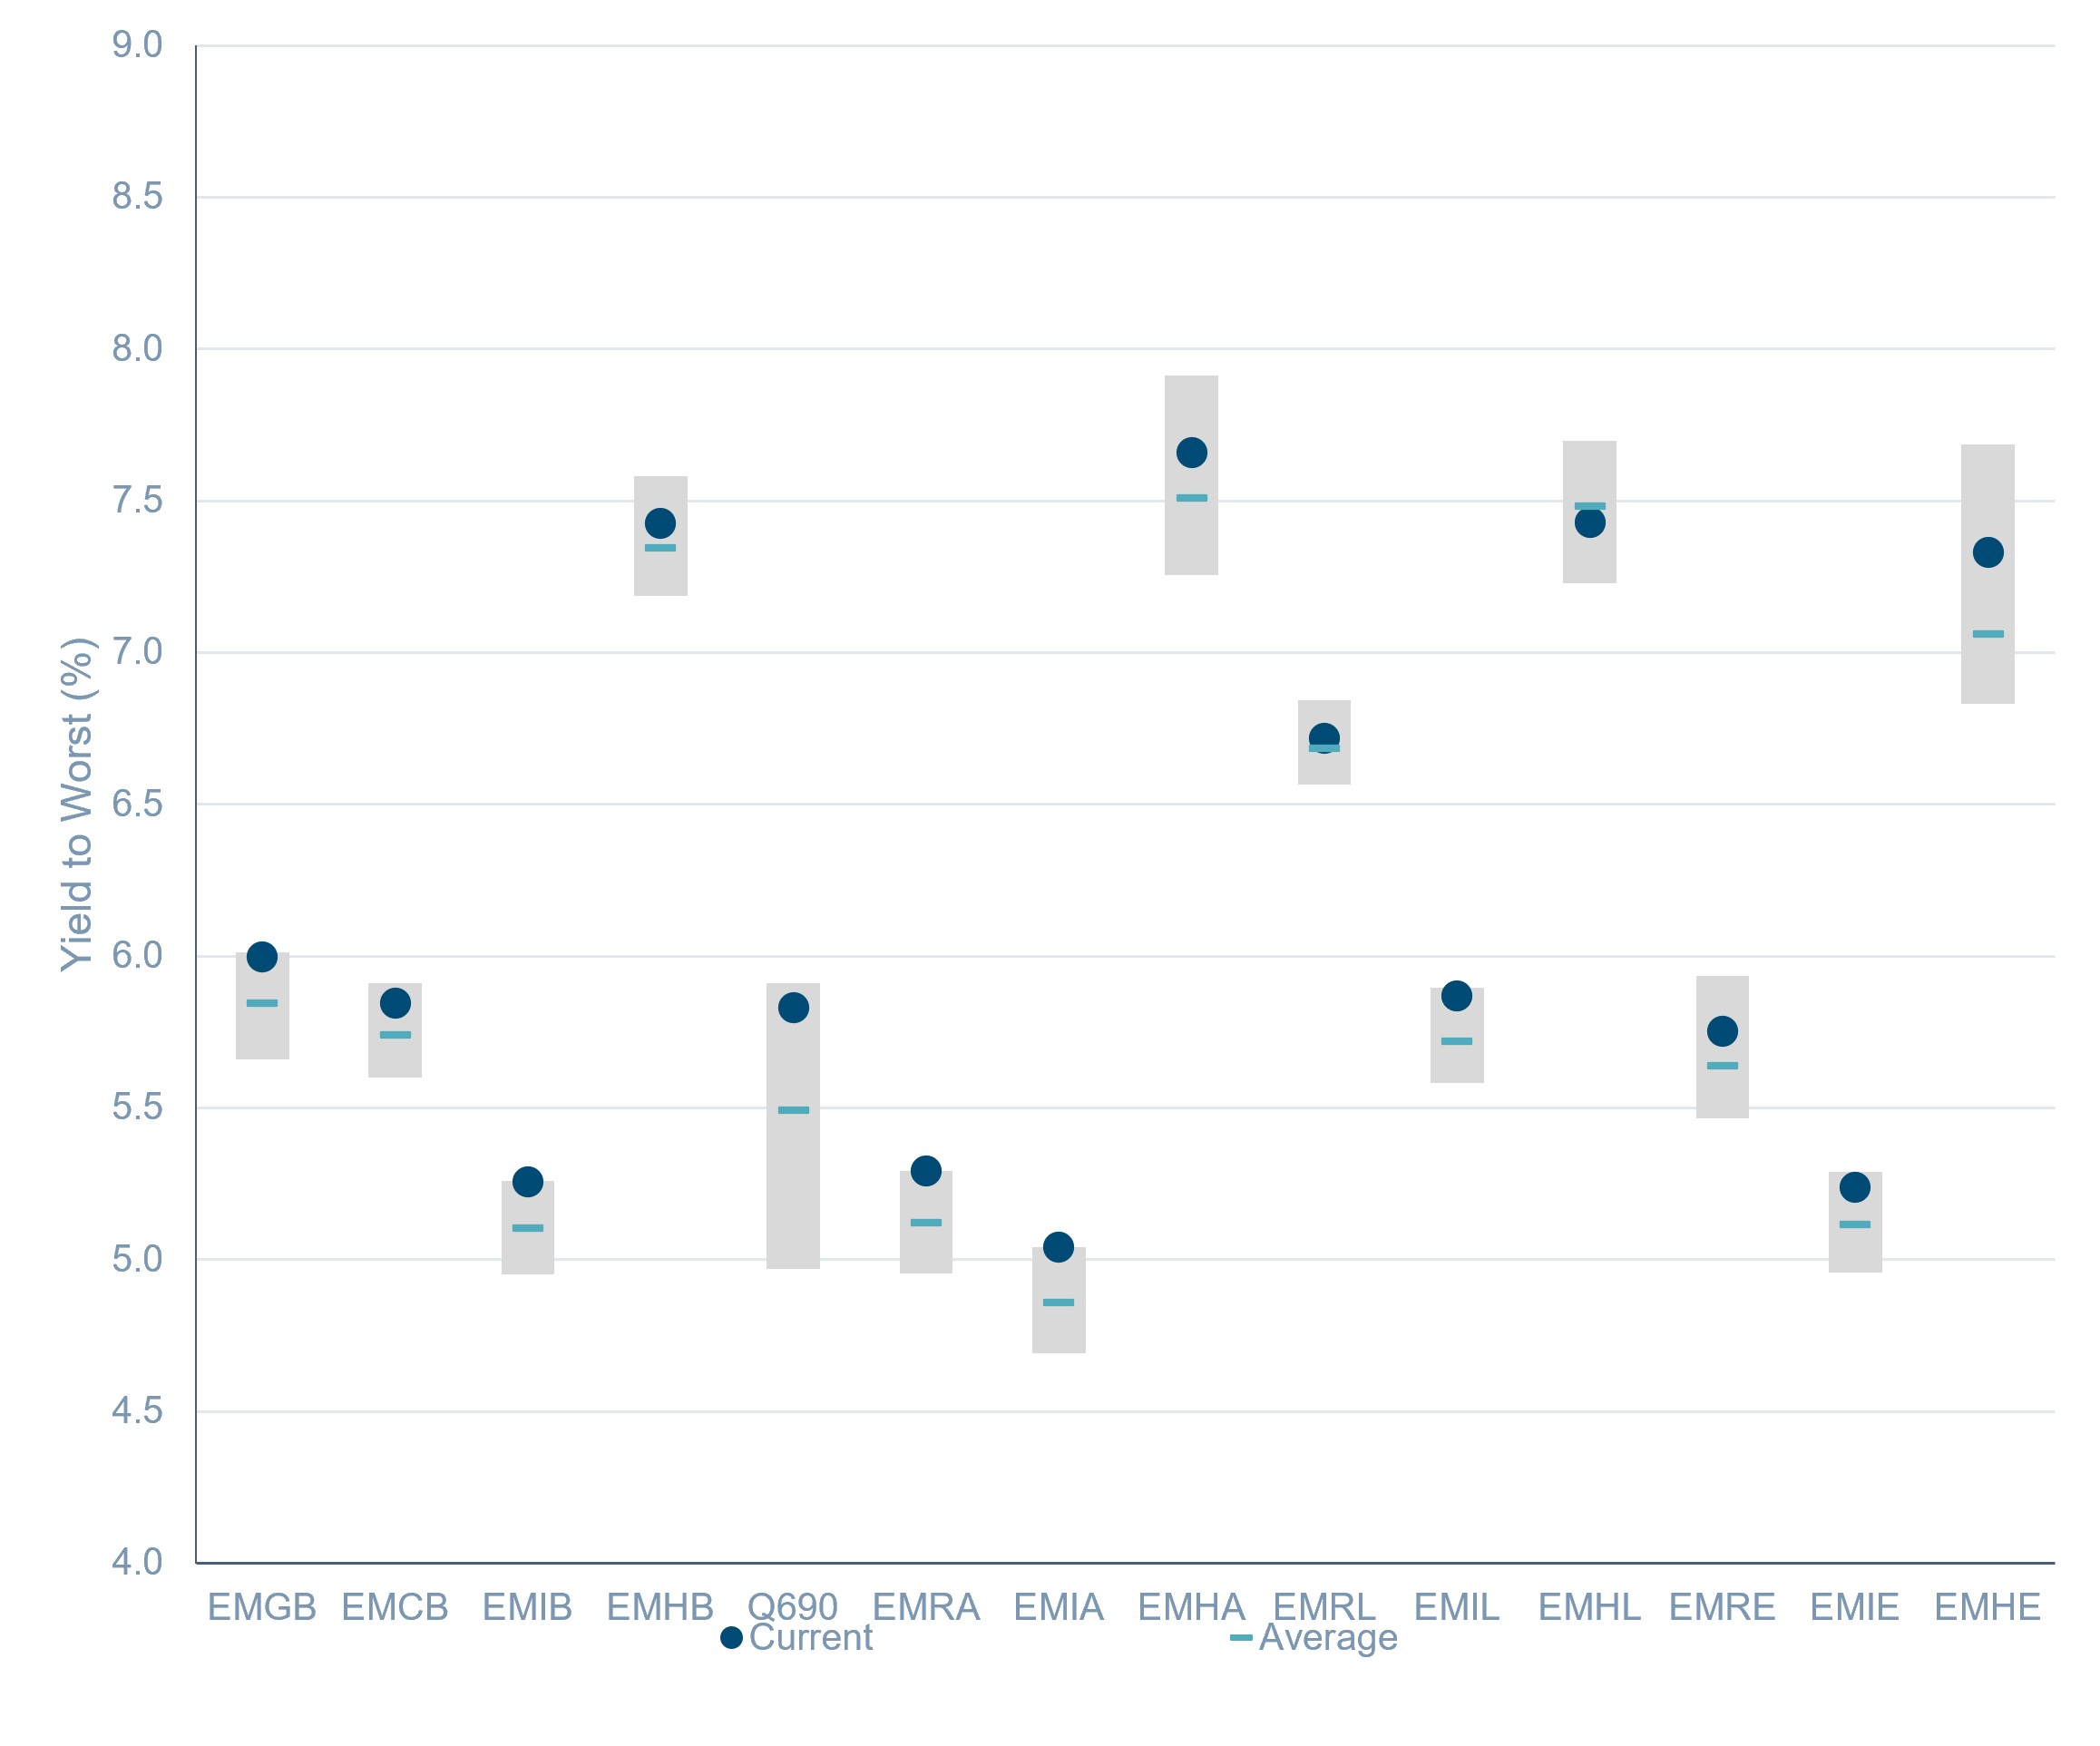
Source: ICE data platform. as of 31st August 2026. EMGB - ICE BofA Emerging Markets External Sovereign Index EMCB - ICE BofA Emerging Markets Corporate Plus Index, EMIB - ICE BofA High Grade Emerging Markets Corporate Plus Index, EMHB - ICE BofA High Yield Emerging Markets Corporate Plus Index, Q690 - ICE BofA Custom Emerging Markets Short Duration Index, EMRA - ICE BofA Asia Emerging Markets Corporate Plus Index, EMIA - ICE BofA High Grade Asia Emerging Markets Corporate Plus Index, EMHA - ICE BofA High Yield Asia Emerging Markets Corporate Plus Index , EMRL - ICE BofA Latin America Emerging Markets Corporate Plus Index, EMIL - The ICE BofA High Grade Latin America Emerging Markets Corporate Index, EMHL - ICE BofA High Yield Latin America Emerging Markets Corporate Plus, EMRE - ICE BofA EMEA Emerging Markets Corporate Plus Index, EMIE - ICE BofA High Grade EMEA Emerging Markets Corporate Plus Index, EMHE - ICE BofA High Yield EMEA Emerging Markets Corporate Plus Index,. Index performance is for illustrative purposes only. You cannot invest directly in the index. Indices selected provide best proxy for highlighting performance of emerging market corporate bonds. For illustrative purposes only.
References
1.International Monetary Fund, as of April 2026.
2. Reuters, as of 27 April 2026. Moody's flags resilience in China economy, moves outlook to 'stable'.
3. OECD Economic Outlook, Volume 2026 Issue 1, as of 3 June 2026.
4.The Business Times, as of 10 March 2026. Apple now makes about 25% of iPhones in India after China pivot.
5.OECD, Accelerating sustainable infrastructure investments, as of 12 June 2026.
6. International Energy Agency, as of 28 May 2026. Impacts of Middle East conflict set to reshape energy investment plans as disruptions put focus on security.
-------
Index descriptions
EMGB - ICE BofA Emerging Markets External Sovereign Index tracks the performance of US dollar and euro denominated emerging markets sovereign debt publicly issued in the major domestic and eurobond markets. Qualifying securities must have risk exposure to countries other than members of the FX-G10, all Western European countries and territories of the US and Western European countries.
EMCB - ICE BofA Emerging Markets Corporate Plus Index tracks the performance of the US dollar and euro denominated emerging markets non-sovereign debt publicly issued in the major domestic and eurobond markets. Qualifying issuers must have risk exposure to countries other than members of the FX G10, all Western European countries, and territories of the US and Western European countries.
EMIB - ICE BofA High Grade Emerging Markets Corporate Plus Index is a subset of the ICE BofA ML Emerging Markets Corporate Plus Index (EMCB) including all securities rated AAA through BBB3, inclusive.
EMHB - ICE BofA High Yield Emerging Markets Corporate Plus Index is a subset of the ICE BofA ML Emerging Markets Corporate Plus Index (EMCB) including all securities rated BB1 or lower.
Q690 - ICE BofA Custom Emerging Markets Short Duration Index tracks the performance of short-term US dollar and euro denominated emerging markets non-sovereign debt publicly issued in the major domestic and eurobond markets.
EMRA - ICE BofA Asia Emerging Markets Corporate Plus Index is the subset of the ICE BofAML Emerging Markets Corporate Plus Index, which includes only securities issued by countries associated with the region of Asia, excluding Kazakhstan, Kyrgyzstan, Tajikistan, Turkmenistan, and Uzbekistan.
EMHA – The ICE BofA High Yield Asia Emerging Markets Corporate Plus Index is a subset of ICE BofA Emerging Markets Corporate Plus Index including all securities rated BB1 and lower with a country of risk within the Asia region.
EMIA - The ICE BofA High Grade Asia Emerging Markets Corporate Plus Index is a subset of ICE BofA Emerging Markets Corporate Plus Index including all securities rated BBB3 and higher with a country of risk within the Asia region.
EMRL - ICE BofA Latin America Emerging Markets Corporate Plus Index is a subset of The ICE BofA Emerging Markets Corporate Plus Index including all securities issued by countries associated with the geographical region of Latin America.
EMIL - The ICE BofA High Grade Latin America Emerging Markets Corporate Index is a subset of ICE BofA Emerging Markets Corporate Plus Index including all securities rated BBB3 and higher with a country of risk within the Latin America region.
EMHL - ICE BofA High Yield Latin America Emerging Markets Corporate Plus is a subset of ICE BofA Emerging Markets Corporate Plus Index including all securities rated sub-investment grade based on the average of Moody's, S&P and Fitch, and with a country of risk associated with the geographical region of Latin America.
EMRE - ICE BofA EMEA Emerging Markets Corporate Plus Index is a subset of The ICE BofA Emerging Markets Corporate Plus Index including all securities issued by countries associated with the geographical region of Europe, the Middle East and Africa including Kazakhstan, Kyrgyzstan, Tajikistan, Turkmenistan and Uzbekistan.
EMIE - ICE BofA High Grade EMEA Emerging Markets Corporate Plus Index is a subset of ICE BofA Emerging Markets Corporate Plus Index including all securities rated BBB3 and higher with a country of risk within the Europe, Middle East and Africa regions.
EMHE - ICE BofA High Yield EMEA Emerging Markets Corporate Plus Index is a subset of ICE BofA Emerging Markets Corporate Plus Index including all securities rated BBB3 and higher with a country of risk within the Europe, Middle East and Africa regions.
The MSCI EM Index is a free-float weighted equity index that captures large and mid cap representation across emerging market countries. The index covers approximately 85% of the free float-adjusted market capitalisation in each country.
LDMP - ICE BofA Local Debt Markets Plus Index is designed to track the performance of emerging markets sovereign debt publicly issued and denominated in the issuer's own currency.
J0A0 - The ICE BofA ML US Cash Pay High Yield Index tracks the performance of US dollar denominated below investment grade corporate debt, currently in a coupon paying period that is publicly issued in the US domestic market.
J0A1 – The ICE BofA BB US Cash Pay High Yield Index is a subset of the ICE BofA US Cash Pay High Yield Index (J0A0) including all securities rated BB1 through BB3, inclusive.
C0C0A0 - The ICE BofA ML US Corporate Index tracks the performance of US dollar denominated investment grade corporate debt publicly issued in the US domestic market.
HE00 - The ICE BofA ML Euro High Yield Index tracks the performance of EUR dominated below investment grade corporate debt publicly issued in the euro domestic or eurobond markets.
ER00 – The ICE BofA ML Euro Corporate Index tracks the performance of EUR denominated investment grade corporate debt publicly issued in the eurobond or Euro member domestic markets.
ICE BofA High Yield Emerging Markets Corporate Plus India Issuers Index (EINH) - is a subset of ICE BofA Emerging Markets Corporate Plus Index
ADHY - ICE BofA Asian Dollar High Yield Index tracks the performance of sub-investment grade U.S. dollar denominated sovereign, quasi-government, corporate, securitized and collateralized debt publicly issued in the U.S. domestic and eurobond markets by Asian issuers.
ICE BofA BB Asian Dollar High Yield Index (ACH1) ICE BofA BB Asian Dollar High Yield Index is a subset of ICE BofA Asian Dollar High Yield Corporate Index including all securities rated BB1 through BB3, inclusive.
ADIG - ICE BofA Asian Dollar Investment Grade Index tracks the performance of investment grade U.S. dollar denominated sovereign, quasi-government, corporate, securitized and collateralized debt publicly issued in the U.S. domestic and eurobond markets by Asian issuers. Qualifying securities have a country of risk classified as an Emerging Markets country that is part of the Asia/Pacific Region.
CEMBI Broad Div. Index - The JP Morgan CEMBI Broad Diversified Index (CEMBIB Div) is a benchmark that tracks the performance of US dollar-denominated, fixed and floating-rate debt instruments issued by emerging market corporate entities.
JESG CEMBI Broad Div. Index - The JP Morgan ESG CEMBI Broad Diversified Custom Maturity Index tracks liquid, US Dollar denominated emerging market fixed and floating-rate debt instruments issued by corporates.
EM3B – ICE BofA BB Emerging Markets Corporate Plus Index is a subset of the ICE BofA Emerging Markets Corporate Plus Index including ass securities rated BB1 through BB3, inclusive.
EMCS – ICE BofA Emerging Markets Corporate Plus Consumer Index is a subset of ICE BofA Emerging Markets Corporate Plus Index including all securities of Consumer Cyclical and Consumer Non-Cyclical issuers.
EMEN – ICE BofA Emerging Market Corporate Plus Energy Index is a subset of ICE BofA Emerging Markets Corporate Plus Index including all securities of Energy issuers.
EMRB – ICE BofA Emerging Market Corporate plus Real Estate, Building & Hotels Index is a subset of ICE BofA Emerging Markets Corporate Plus Index including all securities of Real Easte, Building & Construction, or Hotels.
EMCG – ICE BofA Emerging Markets Corporate Plus Capital Goods Index is a subset of ICE BofA Emerging Markets Corporate Plus Index including all securities of Capital Goods Issuers.
EMSD – ICE BofA Emerging Markets Diversified Corporate Index tracks the performance of USD dollar denominated emerging markets corporate senior and secured debt publicly issued in the US domestic and eurobond markets.
EMTM – ICE BofA Emerging Markets Corporate Plus Media & Telecommunications Index is a subset of ICE BofA Emerging Markets Corporate Plus index including all securities of media and telecommunications issuers.
EM2B – ICE BofA BBB Emerging Markets Corporate Plus Index is a subset of the ICE BofA Emerging Market Corporate Plus index including all securities rated BBB1 through BBB3, inclusive.
EMUT – the ICE BofA Emerging Markets Corporate Plus Utility Index is a subset of the ICE BofA Emerging Markets Corporate Plus Index including all securities of Utility issuers.
EMPB – ICE BofA Public Sector Issuers Emerging Markets Corporate Plus Index is a subset of The BofA Emerging Markets Corporate Plus Index including all quasi-government securities as well as debt of corporate issuers deemed to be government owned or controlled.
ACIG – ICE BofA Asian Dollar Investment Grade Corporate Index tracks the performance of investment grade US dollar denominated securities issued by Asian corporate issuers in the US domestic and eurobonds market. Qualyfying securities have a country of risk associated with Bangladesh, Bhutan, Cambodia, China, John Kong, India, Indonesia, Laos, Macau, Malaysia, Mongolia, Myanmar, Nepal, Pakistan, Papua New Guinea, Philippines, Singapore, South Korea, Sri Lanka, Taiwan, Thailand and Vietnam.
EMAB – Ice BofA Automotive & Basic Industry Emerging Markets Corporate Plus Index is a subset of the ICE BofA Emerging Markets Corporate Plus Index.
EMHE - The ICE BofA High Yield EMEA Emerging Markets Corporate Plus Index is a subset of ICE BofA Emerging Markets Corporate Plus Index including all securities rated BBB3 and higher with a country of risk within the Europe, Middle East and Africa regions.
EMNS – The ICE BofA Non-Financial Emerging Markets Corporate Plus Index is a subset of the ICE BofA Emerging Markets Corporate Plus Index excluding all financial securities as well as debt of corporate issuers designated as government owned or controlled by ICE BofA emerging markets credit research.
EM1B – the ICE BofA AAA-A Emerging Markets Corporate Plus Index is a subset of the ICE BofA Emerging Market Corporate Plus Index including all securities rated AAA through A3, inclusive.
including all securities with India as the country of risk that are rated sub-investment grade based on average of Moody's, S&P and Fitch
ADOL -The ICE BofA Asian Dollar Index tracks the performance of U.S. dollar denominated sovereign, quasi-government, corporate, securitized and collateralized debt publicly issued in the U.S. domestic and eurobond markets by Asian issuers.
ICE BofA China Corporate Index (CN0C) ICE BofA China Corporate Index tracks the performance of CNY denominated corporate debt issued in the Chinese domestic bond market. Qualifying securities must have at least one year remaining term to final maturity, at least 18 months to final maturity at point of issuance, a fixed coupon schedule and a minimum amount outstanding of CNY 500 million. Callable perpetual securities qualify provided they are at least one year from the first call date. Fixed-to-floating rate securities also qualify provided they are callable within the fixed rate period and are at least one year from the last call prior to the date the bond transitions from a fixed to a floating rate security. Contingent capital securities (“cocos”) are excluded, but capital securities where conversion can be mandated by a regulatory authority, but which have no specified trigger, are included. Other hybrid capital securities, such as those issues that potentially convert into preference shares, those with both cumulative and non-cumulative coupon deferral provisions, and those with alternative coupon satisfaction mechanisms, are also included in the index. Securities in legal default are excluded from the Index.
ICE BofA Investment Grade Emerging Markets Corporate Plus China Issuers Index (ECNI) ICE BofA Investment Grade Emerging Markets Corporate Plus China Issuers Index is a subset of ICE BofA Emerging Markets Corporate Plus Index including all securities with China as the country of risk that are rated investment grade based on average of Moody's, S&P and Fitch. EMFN – EM Corporate Plus Financial is a subset of ICE BofA Emerging Markets Corporate Plus Index including all securities of financial issuers.
EMIE - The ICE BofA High Grade EMEA Emerging Markets Corporate Plus Index is a subset of ICE BofA Emerging Markets Corporate Plus Index including all securities rated BBB3 and higher with a country of risk within the Europe, Middle East and Africa regions.
EM4B – ICE BofA B & Lower Emerging Markets Corporate Plus Index is a subset of the ICE BofA Emerging Markets Corporate Plus Index.
EMRT – ICE BofA Emerging Markets Corporate Plus Transportation Index is a subset of ICE BofA Emerging Markets Corporate Plus Index including all securities of Transportation issuers other than airlines or railroads.
GSFCI - The Goldman Sachs Financial Conditions Index is a measure that assesses the overall financial conditions in the economy, taking into account various factors such as interest rates, credit spreads, and equity prices.
ICE BofA B Asian Dollar High Yield Index (ACH2) ICE BofA B Asian Dollar High Yield Index is a subset of ICE BofA Asian Dollar High Yield Corporate Index including all securities rated B1 through B3, inclusive.
ICE BofA Single-B US Cash Pay High Yield Index (J0A2) ICE BofA Single-B US Cash Pay High Yield Index is a subset of ICE BofA US Cash Pay High Yield Index including all securities rated B1 through B3, inclusive.
You cannot invest directly in an index, which also does not take into account trading commissions or costs. Additionally, indices do not include reinvestment of dividends, and the volatility of indices may be materially different over time.
--------
Important information
Muzinich and/or Muzinich & Co. referenced herein is defined as Muzinich & Co., Inc. and its affiliates. Muzinich views and opinions. This material has been produced for information purposes only and as such the views contained herein are not to be taken as investment advice. Opinions are as of date of publication and are subject to change without reference or notification to you. Past performance is not a reliable indicator of current or future results and should not be the sole factor of consideration when selecting a product or strategy. The value of investments and the income from them may fall as well as rise and is not guaranteed and investors may not get back the full amount invested. Rates of exchange may cause the value of investments to rise or fall.
Any research in this document has been obtained and may have been acted on by Muzinich for its own purpose. The results of such research are being made available for information purposes and no assurances are made as to their accuracy. Opinions and statements of financial market trends that are based on market conditions constitute our judgment and this judgment may prove to be wrong. The views and opinions expressed should not be construed as an offer to buy or sell or invitation to engage in any investment activity, they are for information purposes only.
This discussion material contains forward-looking statements, which give current expectations of future activities and future performance. Any or all forward-looking statements in this material may turn out to be incorrect. They can be affected by inaccurate assumptions or by known or unknown risks and uncertainties. Although the assumptions underlying the forward-looking statements contained herein are believed to be reasonable, any of the assumptions could be inaccurate and, therefore, there can be no assurances that the forward-looking statements included in this discussion material will prove to be accurate. In light of the significant uncertainties inherent in the forward-looking statements included herein, the inclusion of such information should not be regarded as a representation that the objectives and plans discussed herein will be achieved. Further, no person undertakes any obligation to revise such forward-looking statements to reflect events or circumstances after the date hereof or to reflect the occurrence of unanticipated events.
United States: This material is for Institutional Investor use only – not for retail distribution. Muzinich & Co., Inc. is a registered investment adviser with the Securities and Exchange Commission (SEC). Muzinich & Co., Inc.’s being a Registered Investment Adviser with the SEC in no way shall imply a certain level of skill or training or any authorization or approval by the SEC.
United Arab Emirates (UAE): This information is provided for discussion and informational purposes only and does not constitute an offer or solicitation in the UAE. It is intended solely for Professional Investors and should not be relied upon by any other person. This material has not been reviewed or approved by the UAE Securities and Commodities Authority, the UAE Central Bank or any other relevant authority. Nothing contained herein constitutes investment, legal, tax or other professional advice. Recipients should make their own independent assessment where appropriate.
Abu Dhabi Global Market (ADGM): This information is provided for discussion and informational purposes only and does not constitute an offer or solicitation in the ADGM. It is intended solely for Professional Clients (as defined by the Financial Services Regulatory Authority) and should not be relied upon by any other person. This material has not been reviewed or approved by the Financial Services Regulatory Authority or any other relevant authority in the UAE.
Issued in the European Union by Muzinich & Co. (Ireland) Limited, which is authorized and regulated by the Central Bank of Ireland. Registered in Ireland, Company Registration No. 307511. Registered address: 32 Molesworth Street, Dublin 2, D02 Y512, Ireland. Issued in Switzerland by Muzinich & Co. (Switzerland) AG. Registered in Switzerland No. CHE-389.422.108. Registered address: Tödistrasse 5, 8002 Zurich, Switzerland. Issued in Singapore and Hong Kong by Muzinich & Co. (Singapore) Pte. Limited, which is licensed and regulated by the Monetary Authority of Singapore. Registered in Singapore No. 201624477K. Registered address: 6 Battery Road, #26-05, Singapore, 049909. Issued in all other jurisdictions (excluding the U.S.) by Muzinich & Co. Limited. which is authorized and regulated by the Financial Conduct Authority. Registered in England and Wales No. 3852444. Registered address: 8 Hanover Street, London W1S 1YQ, United Kingdom. 2026-09-02-19307

By clicking "Submit", I am (i) signing up to receive the Opinion Pieces from the "Opinions" page of the Muzinich & Co website, (ii) representing that the above information is true and accurate and (iii) agreeing to join the Muzinich & Co mailing list. I understand that Muzinich & Co will not add retail investors or individuals with personal email addresses to its mailing list and represent that I am not a retail investor. By providing my personal and professional information I am consenting to its use and disclosure in accordance with the Muzinich & Co. Privacy Policy. I understand that I may withdraw my consent and unsubscribe from receiving future communications by clicking "Unsubscribe" from the emails that are sent to me from Muzinich & Co.

Oct 16, 2026
EM monthly - Latin America makes the “Right Turn”
A political shift to the right is reshaping Latin America, raising expectations of more market-friendly policies, greater fiscal discipline and closer ties with Washington. With Brazil potentially the latest country to follow suit, could this realignment create a virtuous cycle of investment, growth and improving credit fundamentals across the region?

Jul 30, 2026
Emerging Markets: The Half-Time Team Talk
What does a football half-time team talk have in common with emerging market credit? In our latest Muzinich Podcast, Warren Hyland, Head of Emerging Markets, uses the football-inspired framework from his latest Emerging Markets Monthly, Half Time, to reflect on the first six months of the year and discuss the outlook for the remainder of 2026.

Jul 23, 2026
As markets head into the second half, resilient fundamentals and supportive technicals continue to underpin emerging market credit. Warren Hyland takes stock of an eventful first six months and sets out his starting line-up for navigating the opportunities and risks for the second half of the year.