Muzinich Weekly Market Comment: History says don’t panic, but reopening the Strait of Hormuz is key
Insight
March 9, 2026
If you have any feedback on this article or are interested in subscribing to our content, please contact us at opinions@muzinich.com or fill out the form on the right hand side of this page.
--------
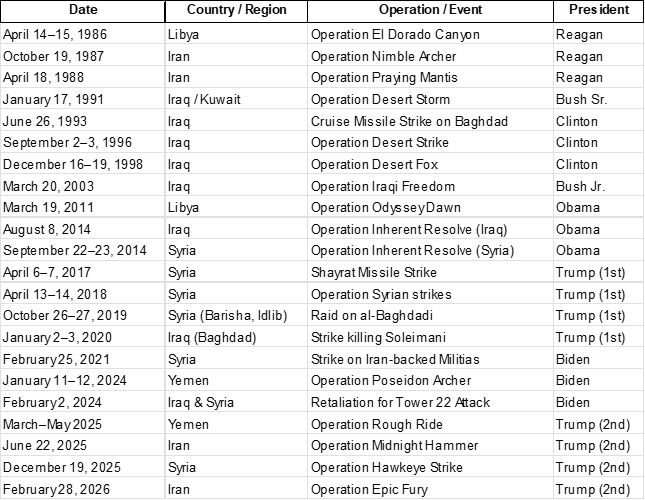
It has been a difficult start to the month, and one need look no further than the unfolding conflict in the Middle East to identify the catalyst for recent price action. What may surprise some is that US airstrike operations in the Middle East are far from uncommon. Over the past four decades, there have been 22 such operations, including Epic Fury. President Trump alone authorized eight of these strikes, more than any other president during this period. See the list below in the Chart of the Week. [1]
The reaction of the financial markets to these events has been broadly consistent over time. Volatility tends to rise as investors attempt to recalibrate the uncertainty associated with event risk, reassessing the additional risk premium required to remain invested, and evaluating the potential knock-on effects for growth and inflation. Our preferred volatility indicator, the VIX, has followed this pattern, rising above 25 – a level generally associated with elevated market uncertainty – after the operation was announced.
The second consistent pattern is US dollar appreciation. Once again, month-to-date the US dollar has followed this historical trend, strengthening broadly against major global currencies. It is up around 2% against the euro and roughly 3% against the Mexican peso. It is also notable that digital currencies have held their value. Bitcoin has appreciated around 2% month-to-date. Digital currency bulls would likely point to this as evidence supporting the case for Bitcoin as a store of wealth. Alternatively, it may simply suggest that positioning in the speculative asset class is now much cleaner following a difficult six months of performance.
For government bonds, the most common pattern during periods of geopolitical stress has been for yields to fall on a “safe haven” bid. This was the initial reaction following the announcement of the military operation. However, yields later rose throughout the week. With the exception of Japan, major government bond markets have bear flattened month-to-date, with front-end yields significantly underperforming.
Bond vigilantes may argue that this reflects the increasingly fragile state of government balance sheets, given elevated levels of indebtedness and continued fiscal largesse, potentially undermining sovereign bonds’ traditional role as a store of value during periods of global uncertainty.
However, a more plausible explanation may lie in the changing direction of central bank policy. While Japan is currently in the midst of tightening policy, most major central banks have only recently declared victory over inflation, and have either normalized policy, or are in the process of returning policy rates toward neutral levels. The uncertainty surrounding the Middle East – and the likely need to rein in inflation expectations – has led investors to reverse their views on some previously anticipated easing.
The UK government bond market has been the weakest performer, with front-end yields rising by more than 25 basis points (bps) as investors removed two 25bps cuts from the overnight index swap (OIS) curve, with rates now expected to remain broadly stable through the year. In Europe, front-end yields have risen around 20bps, with OIS markets now pricing a full policy rate hike by September this year, compared with previous expectations that rates would remain on hold throughout 2026. In the US, one policy rate cut has been removed from the outlook, with the Federal Open Market Committee (FOMC) now expected to deliver only a single 25bps cut in September. [2]
As for more risky assets, with a view on history, credit spreads would typically be expected to widen and equity markets to underperform, given that investors sit at the most speculative point in the capital structure. Total returns in credit markets are lower month-to-date, although interestingly, high yield has slightly outperformed investment grade. In fact, a European investor positioned unhedged in US high yield would likely be quite pleased with the investment decision month-to-date.
A possible clue to this anomaly may reside in the breakdown of nominal yields. If we split the US 10-year Treasury yield into its components of real yield (growth expectations) and breakeven inflation, what is noticeable is that while breakeven inflation has risen around 10bps to 2.38%, the real yield component has also risen by roughly 10bps to 1.80% (nominal yield = 2.38% + 1.80% = 4.18%). This suggests that investors are increasingly concerned about the possibility of rising inflation but currently see little risk to the growth outlook. High yield corporates are generally more sensitive to deteriorating growth conditions.
Equity markets have been the underperforming asset class, although increasing differentiation is beginning to emerge across regions, driven by positioning, energy costs and concerns over supply disruption. The Korean equity market is a good example of positioning effects, with the KOSPI down more than 10% month-to-date. Europe, as a major energy importer, has been the worst performing region, followed by Asia, another large importer of energy. The Euro Stoxx 50 is down close to 7%. Industrial indices have also underperformed more technology and service-oriented indices, reflecting their greater sensitivity to higher energy costs and potential supply disruptions. A case in point is the Nasdaq, which is down less than 1.0% month-to-date; fears of AI disruption and wasteful capital expenditure that weighed on the index now seem like distant memories.
The final consistent pattern observed across all 22 airstrike operations has been rising energy prices. It is well documented that the Strait of Hormuz represents a critical global energy chokepoint. The strait remains the single most important global energy transit route: roughly 20% of global oil consumption[3] and around 20% of global LNG (liquified natural gas) exports pass through it each day, representing approximately one-third of seaborne oil trade.[4] Year-to-date, oil prices are up around 50%, gasoline prices are close to 60% higher, and European gas prices have risen by more than 75%. An extended closure of the Strait of Hormuz could significantly tighten global financial conditions and exert a meaningful drag on the global economic outlook and financial markets.
The US administration is fully aware of the urgency and potential consequences should the Strait remain closed for an extended period. As a result, it has prioritized actions aimed at degrading Iran’s naval capabilities. President Trump has also ordered, with immediate effect, the United States Development Finance Corporation (DFC) to provide war-risk insurance and guarantees for maritime trade. In addition, the US has indicated it is prepared to offer military escorts for vessels transiting the Strait of Hormuz. [5]
Under a scenario in which cargo flows begin to normalize through the strait over the next two weeks –consistent with the pattern observed in the previous 21 airstrike operations – history suggests markets tend to stabilize relatively quickly. Eight weeks after such events, equity markets have been higher 95% of the time, while oil prices have typically declined. See Chart of the Week below.
However, if the Strait of Hormuz were to remain closed for more than five weeks – a period long enough for global inventories to fall to critically low levels while Middle Eastern storage capacity reaches full utilization, forcing production shut-ins – oil prices could rise aggressively, exceeding US$150 per barrel.
The energy shock experienced in Europe following the onset of the Ukraine–Russia conflict provides a recent example of an event-driven supply shock. In 2022, the DAX fell roughly 25% from peak to trough, with the decline lasting around six months and prices taking approximately twelve months to fully recover. More broadly, if we examine major event-driven market selloffs since the 1800s, the average decline in the S&P 500 has been around 30%, typically lasting about eight months, with markets generally recovering within a year. [6]
Chart of the Week: History Says Don’t Panic, But Reopening the Strait of Hormuz Is Key
US airstrike operations in the Middle East and North Africa
Asset class performance eight weeks after airstrike operation
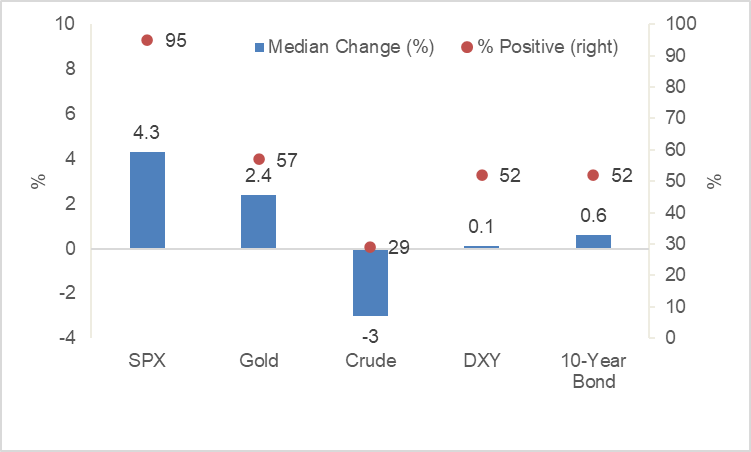
Source: Iran and Middle East Escalation: Geopolitics and Outlook for Financial Markets, Goldman Sachs. For illustrative purposes only.
Past performance is not a reliable indicator of current or future results.
References to specific companies is for illustrative purposes only and does not reflect the holdings of any specific past or current portfolio or account.
This material is not intended to be relied upon as a forecast, research, or investment advice, and is not a recommendation, offer or solicitation to buy or sell any securities or to adopt any investment strategy. The opinions expressed by Muzinich & Co. are as of March 6, 2026, and may change without notice. All data figures are from Bloomberg, as of March 6, 2026, unless otherwise stated.
References
[1] Iran and Middle East Escalation: Geopolitics and Outlook for Financial Markets, Goldman Sachs
[2] Bloomberg, as of March 6, 2026
[3] US Energy Information Administration, as of 16th June 2025. “Amid regional conflict, the Strait of Hormuz remains critical oil chokepoint”
[4] US Energy Information Administration, as of 24th June 2025. “About one-fifth of global liquefied natural gas trade flows through the Strait of Hormuz”
[5] U.S. Naval Institute (USNI) News, “Trump: U.S. Navy May Escort Tankers Through Strait of Hormuz, More European Warships en Route to Med,” March 3, 2026
[6] Goldman Sachs, Market Insights Marquee, “Different Bear Markets Cycles,” March 4, 2026
--------
Important Information
Muzinich & Co., “Muzinich” and/or the “Firm” referenced herein is defined as Muzinich & Co. Inc. and its affiliates. This material has been produced for information purposes only and as such the views contained herein are not to be taken as investment advice. Opinions are as of date of publication and are subject to change without reference or notification to you. Past performance is not a reliable indicator of current or future results and should not be the sole factor of consideration when selecting a product or strategy. The value of investments and the income from them may fall as well as rise and is not guaranteed and investors may not get back the full amount invested. Rates of exchange may cause the value of investments to rise or fall. Emerging Markets may be more risky than more developed markets for a variety of reasons, including but not limited to, increased political, social and economic instability, heightened pricing volatility and reduced market liquidity. Any research in this document has been obtained and may have been acted on by Muzinich for its own purpose. The results of such research are being made available for information purposes and no assurances are made as to their accuracy. Opinions and statements of financial market trends that are based on market conditions constitute our judgment and this judgment may prove to be wrong. The views and opinions expressed should not be construed as an offer to buy or sell or invitation to engage in any investment activity, they are for information purposes only. Any forward-looking information or statements expressed in the above may prove to be incorrect. In light of the significant uncertainties inherent in the forward-looking statements included herein, the inclusion of such information should not be regarded as a representation that the objectives and plans discussed herein will be achieved. Muzinich gives no undertaking that it shall update any of the information, data and opinions contained in the above.
United States: This material is for Institutional Investor use only – not for retail distribution. Muzinich & Co., Inc. is a registered investment adviser with the Securities and Exchange Commission (SEC). Muzinich & Co., Inc.’s being a Registered Investment Adviser with the SEC in no way shall imply a certain level of skill or training or any authorization or approval by the SEC.
In the United Arab Emirates (UAE) (excluding the Dubai International Financial Centre (DIFC) and the Abu Dhabi Global Market (ADGM): This document, and the information contained herein, does not constitute, and is not intended to constitute, a public offer of securities in the United Arab Emirates (“UAE”) and accordingly should not be construed as such. The Units are only being offered to a limited number of exempt Professional Investors in the UAE who fall under one of the following categories: federal or local governments, government institutions and agencies, or companies wholly owned by any of them. The Units have not been approved by or licensed or registered with the UAE Central Bank, the SCA, the Dubai Financial Services Authority, the Financial Services Regulatory Authority or any other relevant licensing authorities or governmental agencies in the UAE (the “Authorities”). The Authorities assume no liability for any investment that the named addressee makes as a Professional Investor. The document is for the use of the named addressee only and should not be given or shown to any other person (other than employees, agents or consultants in connection with the addressee’s consideration thereof).
In the United Arab Emirates (UAE) (including the Dubai International Financial Centre and the Abu Dhabi Global Market): This information does not constitute or form part of any offer to issue or sell, or any solicitation of any offer to subscribe for or purchase, any securities or investment products in the UAE and accordingly should not be construed as such. Furthermore, this information is being made available on the basis that the recipient is an entity fully regulated by the ADGM Financial Services Regulatory Authority (FSRA), and acknowledges and understands that the entities and securities to which it may relate have not been approved, licensed by or registered with the UAE Central Bank, the Dubai Financial Services Authority, the UAE Securities and Commodities Authority, the Financial Services Regulatory Authority or any other relevant licensing authority or governmental agency in the UAE. The content of this report has not been approved by or filed with the UAE Central Bank, the Dubai Financial Services Authority, the UAE Securities and Commodities Authority or the Financial Services Regulatory Authority.
Issued in the European Union by Muzinich & Co. (Ireland) Limited, which is authorized and regulated by the Central Bank of Ireland. Registered in Ireland, Company Registration No. 307511. Registered address: 32 Molesworth Street, Dublin 2, D02 Y512, Ireland. Issued in Switzerland by Muzinich & Co. (Switzerland) AG. Registered in Switzerland No. CHE-389.422.108. Registered address: Tödistrasse 5, 8002 Zurich, Switzerland. Issued in Singapore and Hong Kong by Muzinich & Co. (Singapore) Pte. Limited, which is licensed and regulated by the Monetary Authority of Singapore. Registered in Singapore No. 201624477K. Registered address: 6 Battery Road, #26-05, Singapore, 049909. Issued in all other jurisdictions (excluding the U.S.) by Muzinich & Co. Limited. which is authorized and regulated by the Financial Conduct Authority. Registered in England and Wales No. 3852444. Registered address: 8 Hanover Street, London W1S 1YQ, United Kingdom.