Insight | April 30, 2020
What can the Correction in Oil Mean for Energy Credits? - April 2020

West Texas Intermediate (WTI) oil fell to a record low last week (week of April 20th)1 as demand collapsed in the wake of the COVID-19 lock-down and the Saudi Arabia/Russia price war further exacerbated a supply/demand imbalance. In this brief note we will review the possible drivers of oil prices and what this could mean for energy credits.
What happened to oil futures?
Oil futures contracts (May WTI futures) fell to -$37.63 on April 20, 20202 trading below zero for the first time ever. This price action appears to be rooted in fundamentals as supply has been slow to respond to a substantial drop in demand due to COVID-19 related global lockdowns. In certain regions, physical storage is reaching capacity. Financial imbalances also likely played a role as oil speculators and retail products such as USO oil ETF, created massive long positions as contract expiry approached (Figure 1 illustrates growth in shares outstanding of USO). Only one day prior to contract expiry, open interest in May WTI futures totaled approximately 109 mm barrels3, far exceeding the total physical oil storage working capacity of Cushing, Oklahoma which is approximately 76 mm barrels.4
Fig. 1 – USO oil ETF – Growth in Shares Outstanding
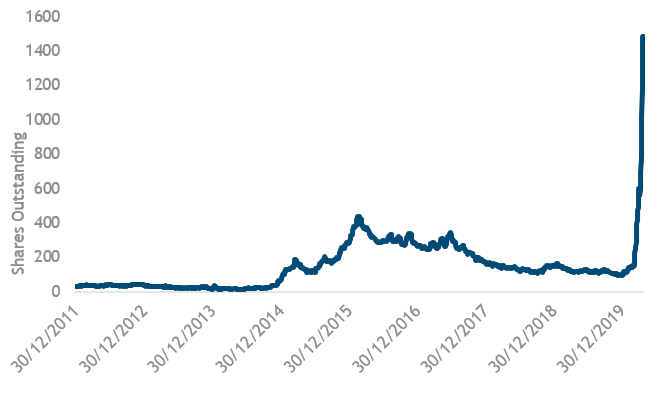 Source: Bloomberg USO ETF as of April 27, 2020. Provided for illustrative purposes only, not an offer or a recommendation to buy, sell or transact in any investments and should not be construed as investment advice.
How did we get to this imbalance?
After decades of decline, the US oil industry experienced a renaissance in 2010 as hydrofracking drilling techniques (previously focused on natural gas production) were utilized to extract crude oil from shale deposits. US oil production grew annually by ~1mm bbl/day between 2011-15 gaining global market share along the way.5
Fig. 2 Global Oil Market Share
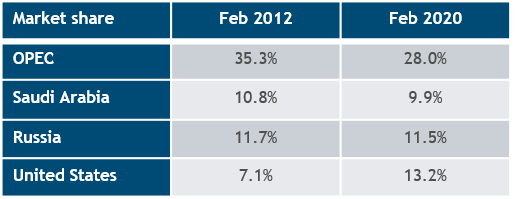 Source: Bloomberg and Energy Intelligence Group as of February 29, 2012 and February 29, 2020.
OPEC’s decision to protect market share gains from 2015-17, rather than price stability, temporarily halted the growth of US oil production. However, OPEC’s actions had unintended consequences including pressuring the US oil industry to lower operating costs and improve technology, thus substantially lowering the cost of fracking. As OPEC joined with Russia in an attempt to control price in 2017, price stability returned, but so did the growth in US Shale oil production. (See Figure 3).
Fig. 3 – United States DOE Crude Oil Total Production
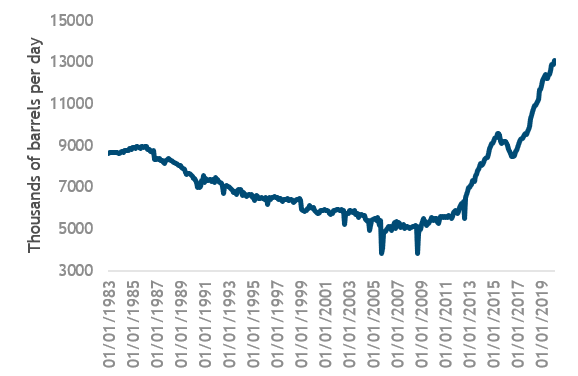 Source: Bloomberg United States DOE Crude Oil Total Production Index data as of March 31, 2020. Provided for illustrative purposes only, please see full index description at the end of this document.
When will oil markets return to some sustainable equilibrium?
The world is oversupplied with oil and the outlook for demand remains uncertain. We believe two developments are necessary to restore crude oil prices to levels that warrant economic reinvestment in energy exploration and development. First, demand needs to return to levels consistent with a globally functioning economy and secondly, production must be curtailed to levels that are consistent with the new norm of global demand.
Crude oil demand has suffered greatly from COVID-19 lockdowns, social isolation and the subsequent economic contraction. US airline passenger demand is estimated to have declined by 90% in April6 and global crude oil demand is estimated to have fallen by 30 mn barrels/day7. We believe that health concerns will persist long after lockdowns are lifted and the “new norm” for economic activity and travel may take 2-3 years to return to pre-COVID 19 levels.
In the face of this outlook, we believe supply must contract. Supply side responses are happening - companies have announced reduced production and investment plans, Saudi Arabia and Russia announced planned production cuts and physical storage limitations may force well shut-ins. However, considering the magnitude of the demand contraction, in our view, the announcements thus far have not been enough to balance markets. We believe the supply side response will take some time to reflect the bleak demand reality due to the fragmented nature of the supplier base, varied sovereign interests, and decisions by individual company to operate for cash / liquidity needs.
What does this mean for US and global energy credits?
We expect US Shale oil production, which has grown rapidly in recent years, will contract and contribute to balancing global supply/demand imbalances. Low commodity prices and weak economic returns will likely reduce exploration and production investments. Contraction of the US Shale oil industry is expected to have negative implications for companies that lack scale, low-cost resources and financial flexibility to manage through the commodity cycle. Nonetheless, we expect US shale oil to remain a key supplier to global hydrocarbon demand given its sheer size, advantaged position on the cost curve, ability to flex up and down quickly to respond to demand and domicile in relatively stable sovereign.
Globally, we expect to observe the following:
- Lower drilling investment will likely drive fundamental weakness for drilling companies (offshore and onshore) due to low capacity utilization and price depreciation.
- High cost, highly leveraged companies will likely default. More than 25% of the US sub-investment grade energy companies defaulted in 2015/16 cycle.8
- Expect fallen angels. Ratings agencies will likely downgrade BBB/BBB- rated energy companies as they revise price forecasts lower.
- Survivors of this prolonged energy cycle will likely be low-cost, low-leveraged (mostly investment grade and higher rated BB) oil producers with financial flexibility to survive the cycle.
- Midstream companies (pipelines) and refineries should likely perform relatively well as these are volume driven rather than commodity price sensitive business models.
- Natural gas may experience counter cyclical upside as oil drilling activity declines (as much as 15-20% of US natural gas is generated as byproduct of oil production).9
- State-owned oil and gas companies will likely benefit from sovereign support due to strategic nature of the enterprise.
How might energy exposure be managed?
We learned several lessons from the energy commodity cycle in 2015/2016 that we believe can help guide how energy exposure may be managed through this correction.
We believe the most valuable lessons we learned from energy commodity cycle in 2015/16 are:
- Sell high cost oil and gas producers with liquidity constraints – recovery rates in energy defaults were below historical norms for non-energy defaults.10
- Avoid drilling services companies tied to exploration and production investment.
- Focus on low-cost producers, with strong liquidity profiles and dynamic management teams.
- Buy long-dated, high quality energy (including investment grade, fallen angels) in efforts to rebuild discount to par and participate in upside upon commodity normalization.
- Hold midstream companies but expect volatility as these bonds may trade with energy sentiment, but fundamentals tend to be less volatile.
1. Bloomberg.
2. Bloomberg.
3. Open interest volume per Bloomberg on April 20, 2020.
4. Independent Statistics and Analysis U.S. Energy Information Administration (EIA) Working and Net Available Shell Storage Capacity November 2019 With Data as of September 30, 2019.
5. Bloomberg and US Energy Information Administration.
6. Source: TSA passenger data as of April 27, 2020. U.S. airline passenger demand is estimated by March and April Total Traveler Throughput https://www.tsa.gov/coronavirus/passenger-throughput
7. US Energy Information Administration, Muzinich estimates as of April 17, 2020.
8. Muzinich analysis based on J.P. Morgan Default Monitor North America Credit Research April 1, 2020 and Bloomberg.
9. Bloomberg and Muzinich estimates as of December 31, 2019.
10. Muzinich observations confirmed by J.P. Morgan Default Monitor North America Credit Research April 1, 2020.
————————————————————————————————————————————-
Important Information
"Muzinich & Co.", “Muzinich” and/or the "Firm" referenced herein is defined as Muzinich & Co., Inc. and its affiliates. This document is for informational purposes only and does not constitute an offer or solicitation of an offer, or any advice or recommendation, to purchase or sell any securities or other financial instruments and may not be construed as such. Past performance is not indicative of future results. The value of an investment, and income generated (if any) may fall as well as rise and is not guaranteed. All information contained herein is believed to be accurate as of the date(s) indicated, is not complete, and is subject to change at any time. Muzinich hereby disclaims any duty to provide any updates or changes to the analysis contained herein. Certain information contained herein is based on data obtained from third parties and, although believed to be reliable, has not been independently verified by anyone at or affiliated with Muzinich; its accuracy or completeness cannot be guaranteed. This document may contain forward-looking statements, which give current expectations of the market’s future activities and future performance. Any or all forward-looking statements in this material may turn out to be incorrect. They can be affected by inaccurate assumptions or by known or unknown risks and uncertainties. Although the assumptions underlying the forward-looking statements contained herein are believed to be reasonable, any of the assumptions could be inaccurate and, therefore, there can be no assurances that the forward-looking statements included in this discussion material will prove to be accurate. In light of the significant uncertainties inherent in the forward-looking statements included herein, the inclusion of such information should not be regarded as a representation that the objectives and plans discussed herein will be achieved. Further, no person undertakes any duty or obligation to revise such forward-looking statements to reflect events or circumstances after the date hereof or to reflect the occurrence of unanticipated events. Any forward looking information or statements expressed in the above may prove to be incorrect. The views and opinions expressed should not be construed as an offer to buy or sell or invitation to engage in any investment activity, they are for information purposes only. Opinions and statements of financial market trends that are based on market conditions constitute our judgement and are subject to change without notice. Historic market trends are not reliable indicators of actual future market behavior. The above is not intended to provide a sufficient basis on which to make an investment decision and should not be construed as investment advice or an offer or solicitation of an offer. Investors should confer with their independent financial, legal or tax advisors. The above is neither independent investment research, nor is it an objective or independent explanation of the matters contained herein, and you must not treat it as such. No part of this material may be reproduced in any form or referred to in any other publication without express written permission from Muzinich.
United States DOE Crude Oil Total Production Data. This data is updated every Wednesday at 10:30 am for the previous week ending Friday. It is taken from text files released by the Energy Information Administration and is part of their weekly petroleum status report at http://www.eia.gov/petroleum/supply/weekly. Data in this weekly report is estimated. Current data estimates are based on weekly data collected by the DOE. Previous year data shown on EIA’s website is based on Petroleum Supply Annual & Petroleum Supply Monthly and is not based on these weekly estimates. Previous year data is likely to be different from the weekly estimate for the same period, but this is not considered a revision of the weekly estimate.
You cannot invest directly in an index, which also does not take into account trading commissions or costs. The volatility of indices may be materially different from the volatility performance of an account or fund.
Muzinich & Co., Inc. is a registered investment adviser with the Securities and Exchange Commission (SEC). Muzinich & Co., Inc.’s being a registered investment adviser with the SEC in no way shall imply a certain level of skill or training or any authorization or approval by the SEC. Issued by Muzinich & Co. Limited, which is authorised and regulated by the Financial Conduct Authority. Registered in England and Wales No. 3852444. Registered address: 8 Hanover Street, London W1S 1YQ.