Turning of the tide
EM Monthly
October 7, 2025
If you have any feedback on this article or are interested in subscribing to our content, please contact us at opinions@muzinich.com or fill out the form on the right hand side of this page.
--------
Interest in emerging market credit is returning as policy easing and potentially attractive valuations renew investor interest.
Over the past three years, EM credit has been weighed down by relentless outflows, geopolitical shocks and tighter global financial conditions. Yet markets evolve. Today, against a backdrop of loosening monetary policy, strong balance sheets and compelling valuations, the case for EM is shifting - and investors are beginning to notice.
The three pillars
From a macro perspective, corporate credit markets are typically evaluated through three key pillars: fundamentals, technicals and valuation. Fundamentals capture the underlying strength of companies, driven by economic growth and pricing power, with bond investors focusing closely on cash flow generation, capital expenditure trends, and ultimately leverage.
Technicals reflect the balance between supply, defined by the difference between new issuance and maturing debt, and demand, as measured through industry fund inflows or outflows.
Valuation encompasses both the risk premium embedded in credit spreads - compensating investors for downgrade risk, volatility, illiquidity and potential default - and the outright yield, which represents the return an investor can expect if conditions remain stable, or the breakeven outcome in an adverse scenario.
Against this analytical backdrop, investors can score and aggregate the three pillars to identify the most attractive sub-asset class opportunities: investment grade versus high yield or emerging markets (EM) versus developed economies.
In recent years, the technical backdrop has been a key factor weighing on EM macro scores, primarily due to persistent investor outflows. Since 2022, the asset class has experienced three consecutive years of outflows, beginning with a sharp US$90 billion withdrawal in 2022 (Figure 1.)
To be fair, 2022 was an exceptionally difficult year for all bond investors, as global central banks tightened financial conditions aggressively in response to the unprecedented stimulus deployed during the Covid-19 crisis.
Figure 1:EM credit fund flows (annual cumulative)
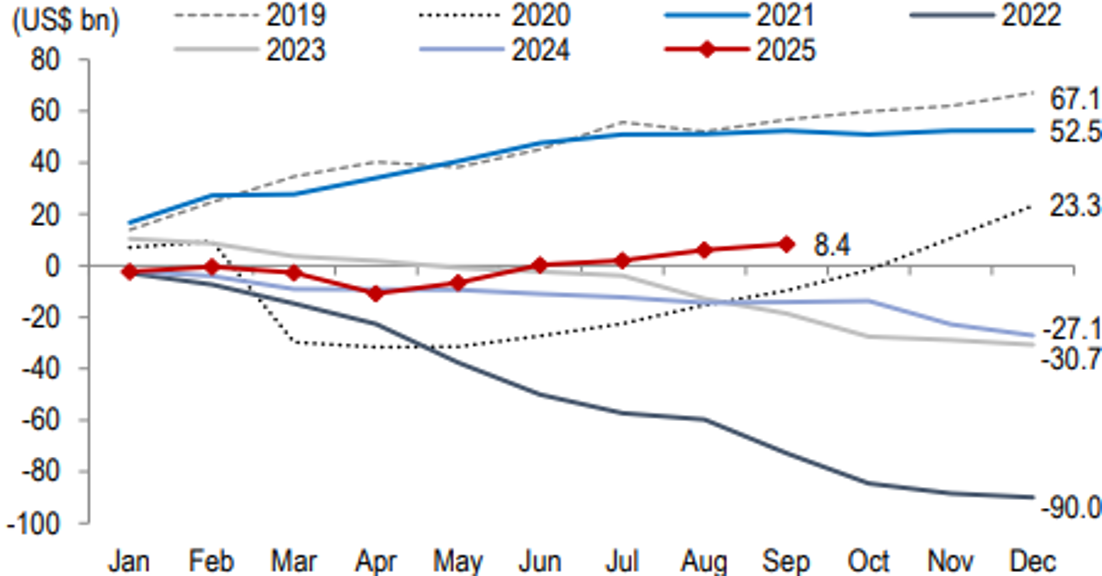
Source: JP Morgan, as of 11th September 2025, “Emerging markets corporate strategy, carry into the fall”. For illustrative purposes only.
Determined to anchor inflation expectations, policymakers signalled their willingness to accept recession as a byproduct of credibility. EM faced additional headwinds from the Russia - Ukraine conflict and the deflation of the China’s property bubble, which began in 2021. The pain was broad-based across fixed income, as were outflows. Paradoxically, the safer segments delivered weaker performance, with high yield outperforming investment grade, while the US 30-year Treasury lost more than 40% of its value as yields more than doubled from 1.90% to 3.65% by year-end.1
Past performance is not a reliable indicator of current or future results.
Figure 2: Credit market inflows/outflows
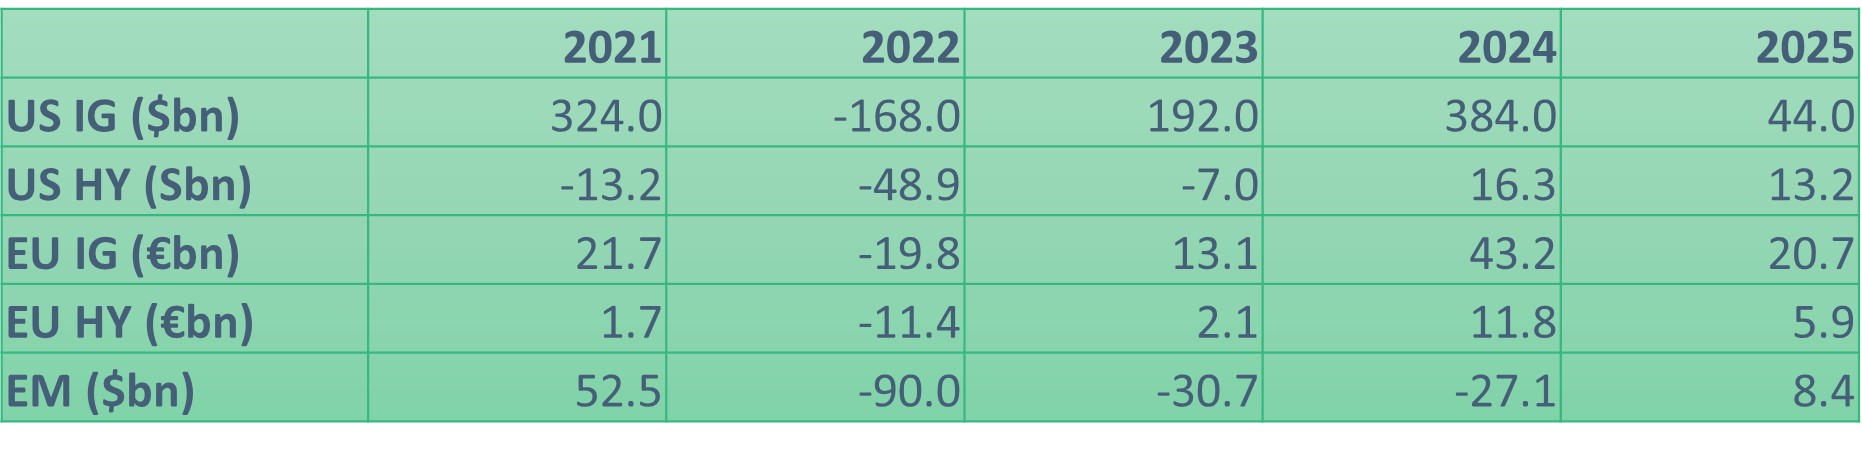 Source: JP Morgan credit research, as of 30th September 2025. For illustrative purposes only.
Differentiated returns
However, differentiation began to emerge in 2023 as investment flows turned positive, particularly into European credit and developed market investment-grade assets.
Although financial conditions remained tight, investors grew more confident the worst was behind them, with overall yields and breakeven levels providing ample compensation.
Sentiment toward EM, however, stayed muted, weighed down by escalating geopolitical risks in the Middle East, persistently tight financial conditions and ongoing fears of a global recession. In hindsight, this caution proved well-founded: while 2023 delivered strong total returns across credit markets, EM credit lagged its developed market peers in both investment-grade and high-yield segments.
After two years of limited funding, exceptionally tight financial conditions, a property bubble collapse and heightened geopolitical conflict, the EM credit universe effectively underwent a cleansing process. Securities from conflict regions were removed from indices, alternative sources of financing - both domestic and private - were tapped, and corporate balance sheets were stress tested. Companies that proved inadequate were either downgraded or forced into default.
Sentiment shifts
This meant EM was positioned favourably in 2024, with both the fundamental and valuation pillars scoring strongly; - fundamentals supported by the index’s prior cleansing, and valuations by relative underperformance versus peers. Nevertheless, investors remained unconvinced of these relative advantages. As flows returned to credit markets, driven by expectations of central banks unwinding restrictive policy, allocations increased across all credit sub-asset classes except EM which registered US$27.1 billion of outflows for 2024 (Figure 2).
This proved to be a poor allocation decision, as EM high-yield credit was the best-performing credit asset class in 2024. While in the investment-grade universe, EM credit also outperformed its US peers and trailed only behind European investment grade, owing to hedge carry profit when converted to US dollars.
Figure 3: Corporate credit US$ total returns
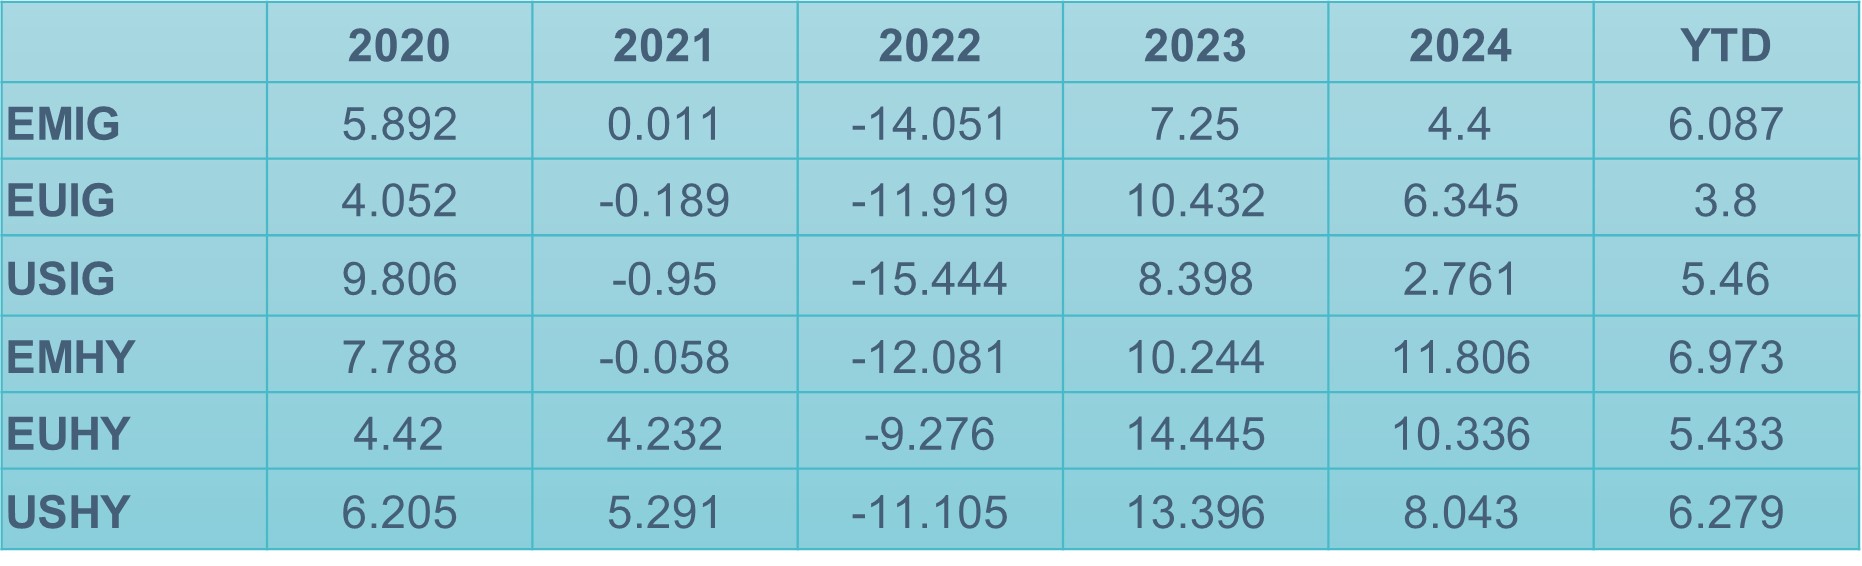
Past performance is not a reliable indicator of current or future results.
Source: ICE Index Platform, as of 30th September 2025. ICE BofA Emerging Market Corporate High Grade Index (EMIG), ICE BofA Emerging Market High Yield Corporate (EMHY), ICE BofA Euro Corporate Index (EUIG), ICE BofA US Corporate Index (USIG) ICE BofA Euro High Yield Index (EUHY), ICE BofA US Cash Pay High Yield Index (USHY). For illustrative purposes only. Indices used represent best proxies to highlight returns in sub-asset classes.
The flow pattern persisted into H1 2025, with inflows across all credit asset classes except EM. However, the tide turned over the summer and, since August, EM credit has recorded consistent inflows, bringing the year-to-date total to US$8.4 billion. Identifying a precise catalyst for this shift in investor sentiment is never straightforward, but we would suggest the following factors.
The tide has turned
From a macro perspective, financial conditions have improved significantly. Interest rates are lower, global central banks are unwinding restrictive policies, the US dollar has depreciated and funding costs have fallen amid easier access to liquidity from companies, (Figure 4).
Figure 4: Global Financial Conditions
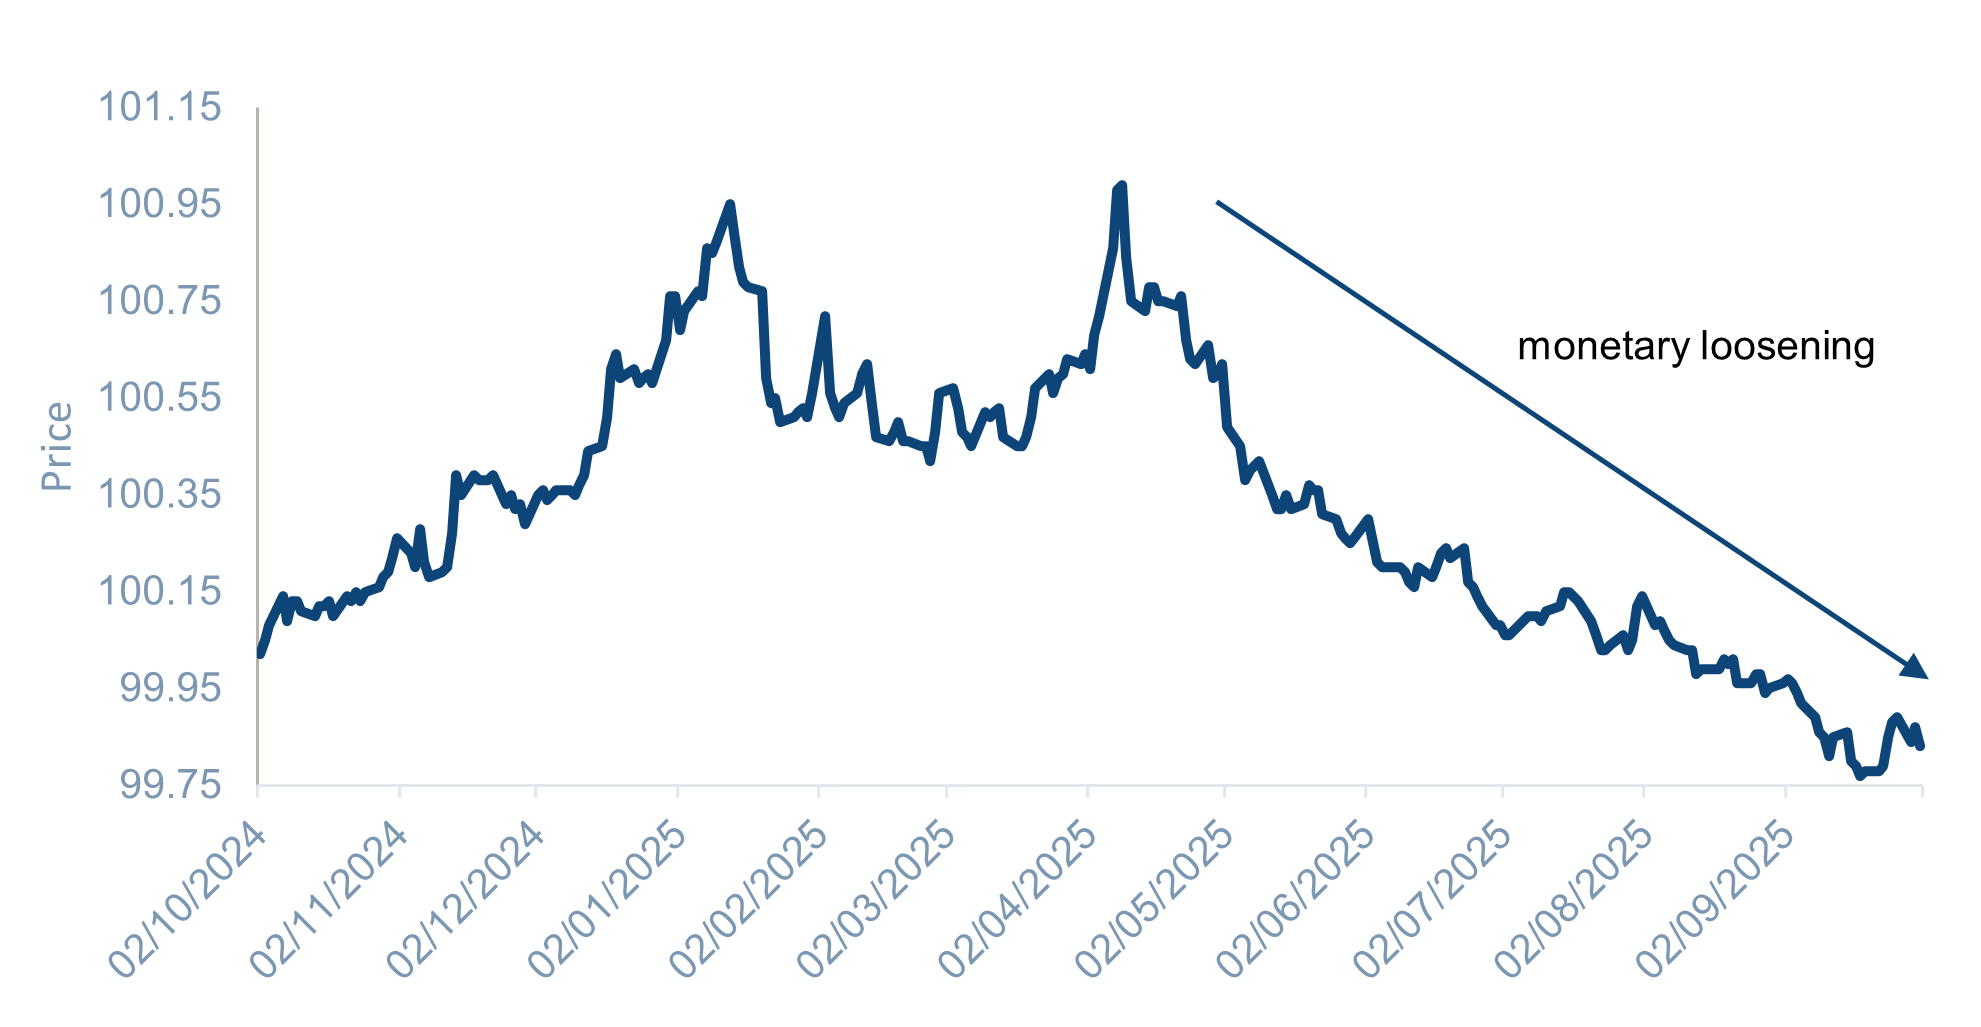
Source: Bloomberg and Goldman Sachs, as of 1st October 2025. Goldman Sachs Global Financial Conditions Index (GSGLFCI). For illustrative purposes only.
This loosening of financial conditions provides a clear tailwind for the EM asset class. Geopolitical risks remain ever-present; however, worst-case scenarios from US tariffs - have largely been priced in, while spillover effects from conflicts in Eastern Europe and the Middle East are currently viewed as limited. The best defence against geopolitical risk is arguably diversification - an area where EM credit is particularly effective. No single sovereign accounts for more than 10% of the index, with exposure spread across 55 countries worldwide.3
From a technical standpoint, supply is often overlooked. The contraction in net issuance from 2022 acted as a stabilizer, helping the universe weather periods of outflows. In fact, one would have to go back to 2020 to find a meaningful imbalance between net demand and supply that worked against investors (Figure 4). This stabilizer has now become an accelerator, as fresh inflows face difficulty sourcing available bonds.
Figure 5: Net supply negative since 2022
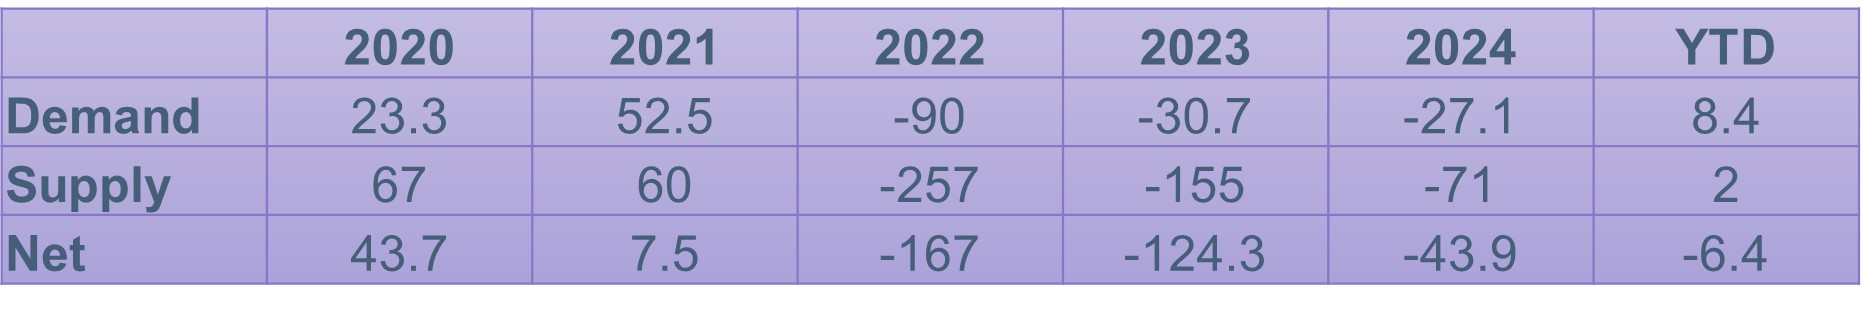 Source: JP Morgan credit research, as of 30th September 2025. For illustrative purposes only.
Finally, from a valuation perspective, after three years of persistent outflows, it is fair to assume investors remain underweight the asset class. As the hunt for yield returns to fixed income - with spreads tightening and central banks moving toward policy easing - EM credit offers a compelling source of “extra yield.” The combination of underweight positioning, renewed demand for yield and confidence generated from an asset class that has outperformed over the past 18 months has shifted the tide; outflows have become inflows.
EM look back – September
Fixed income
EM Credit
Monetary policy
Past performance is not a reliable indicator of current or future results.
Country-specific news
All sources are Bloomberg unless otherwise stated.
This material is not intended to be relied upon as a forecast, research, or investment advice, and is not a recommendation, offer or solicitation to buy or sell any securities or to adopt any investment strategy. The opinions expressed by Muzinich & Co. are as of October 2025 and may change without notice.
Market Data
Credit
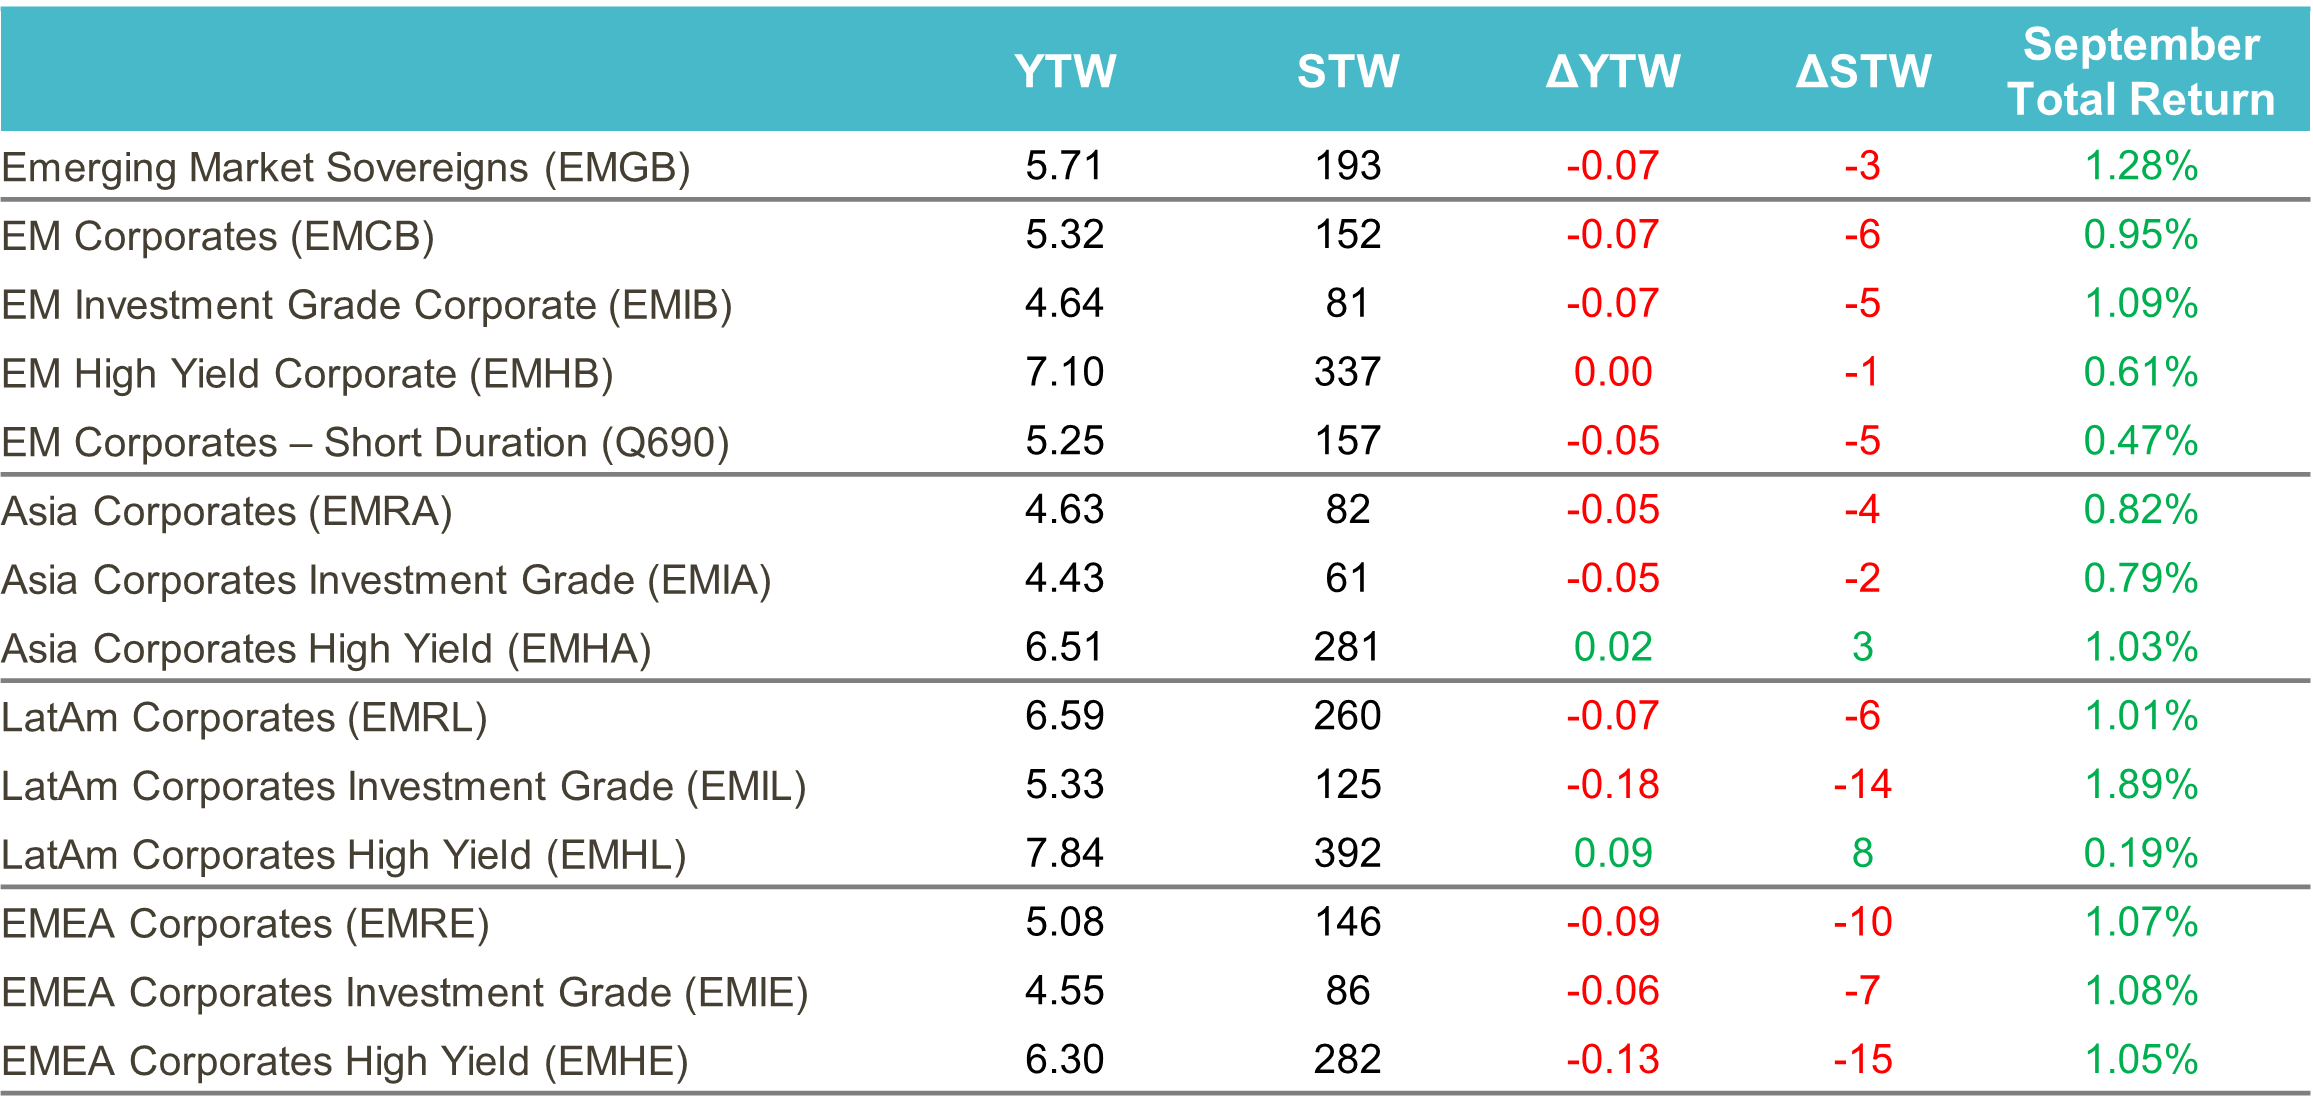
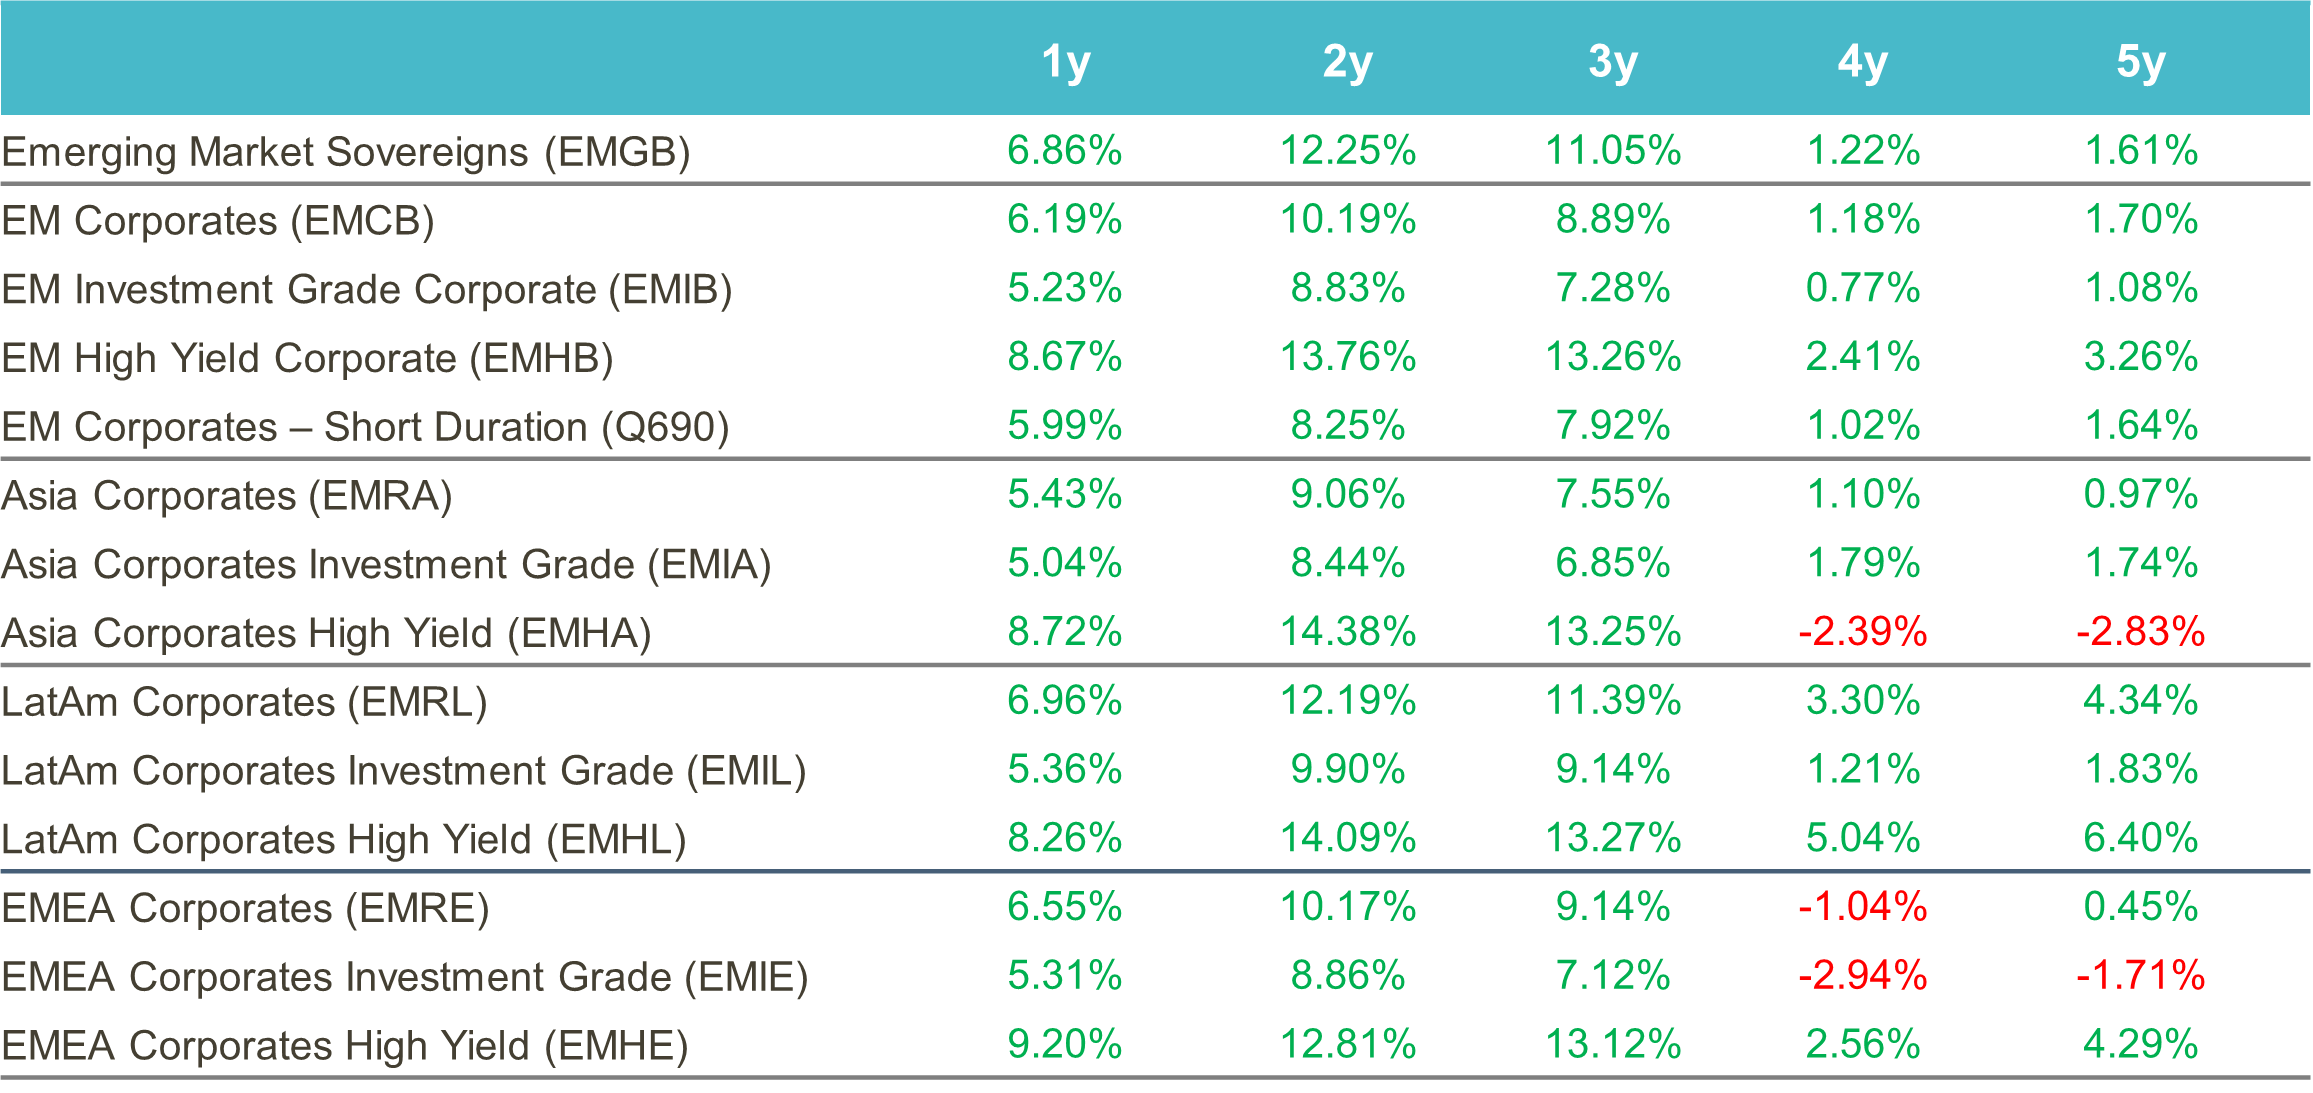
Past performance is not a reliable indicator of current or future results.
Source: ICE data platform. as of 30th September 2025. EMGB - ICE BofA Emerging Markets External Sovereign Index EMCB - ICE BofA Emerging Markets Corporate Plus Index, EMIB - ICE BofA High Grade Emerging Markets Corporate Plus Index, EMHB - ICE BofA High Yield Emerging Markets Corporate Plus Index, Q690 - ICE BofA Custom Emerging Markets Short Duration Index, EMRA - ICE BofA Asia Emerging Markets Corporate Plus Index, EMIA - ICE BofA High Grade Asia Emerging Markets Corporate Plus Index, EMHA - ICE BofA High Yield Asia Emerging Markets Corporate Plus Index , EMRL - ICE BofA Latin America Emerging Markets Corporate Plus Index, EMIL - The ICE BofA High Grade Latin America Emerging Markets Corporate Index, EMHL - ICE BofA High Yield Latin America Emerging Markets Corporate Plus, EMRE - ICE BofA EMEA Emerging Markets Corporate Plus Index, EMIE - ICE BofA High Grade EMEA Emerging Markets Corporate Plus Index, EMHE - ICE BofA High Yield EMEA Emerging Markets Corporate Plus Index,. Index performance is for illustrative purposes only. You cannot invest directly in the index. Indices selected provide best proxy for highlighting performance of emerging market corporate bonds. For illustrative purposes only.
Market Data
Yield to Worst
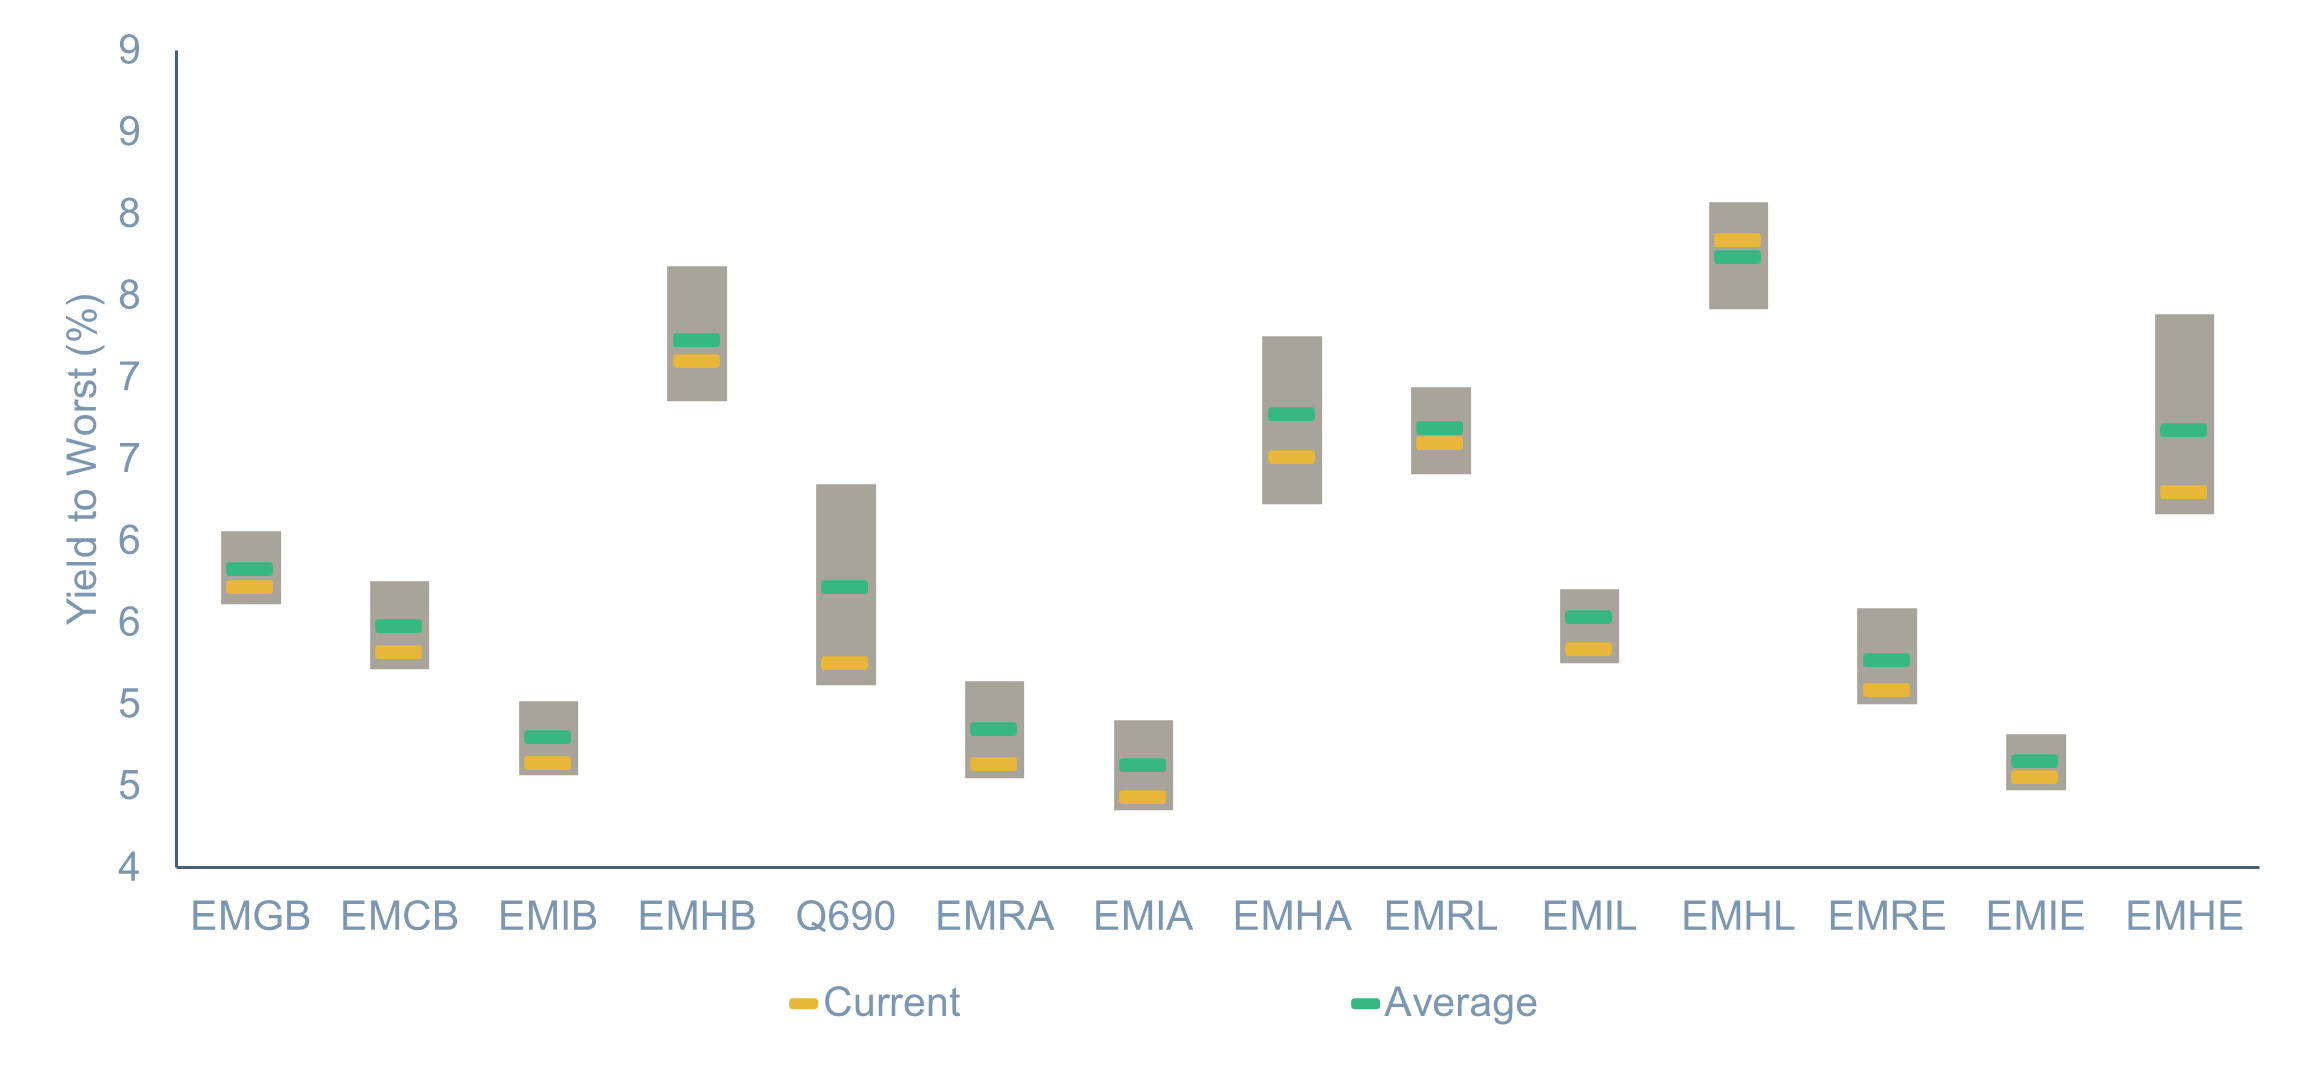
Source: ICE data platform. as of 30th September 2025. EMGB - ICE BofA Emerging Markets External Sovereign Index EMCB - ICE BofA Emerging Markets Corporate Plus Index, EMIB - ICE BofA High Grade Emerging Markets Corporate Plus Index, EMHB - ICE BofA High Yield Emerging Markets Corporate Plus Index, Q690 - ICE BofA Custom Emerging Markets Short Duration Index, EMRA - ICE BofA Asia Emerging Markets Corporate Plus Index, EMIA - ICE BofA High Grade Asia Emerging Markets Corporate Plus Index, EMHA - ICE BofA High Yield Asia Emerging Markets Corporate Plus Index , EMRL - ICE BofA Latin America Emerging Markets Corporate Plus Index, EMIL - The ICE BofA High Grade Latin America Emerging Markets Corporate Index, EMHL - ICE BofA High Yield Latin America Emerging Markets Corporate Plus, EMRE - ICE BofA EMEA Emerging Markets Corporate Plus Index, EMIE - ICE BofA High Grade EMEA Emerging Markets Corporate Plus Index, EMHE - ICE BofA High Yield EMEA Emerging Markets Corporate Plus Index,. Index performance is for illustrative purposes only. You cannot invest directly in the index. Indices selected provide best proxy for highlighting performance of emerging market corporate bonds. For illustrative purposes only.
References
1.ICE Index Platform, as of 31st December 2022. ICE BofA Emerging Market Corporate High Grade Index, (EMIB), ICE BofA Emerging Market High Yield Corporate (EMHB), ICE BofA Current 30-Year US Treasury Index (SO30).
3. ICE Index Platform, as of 30th September 2025. ICE BofA Index Emerging Markets Corporate Plus Index (EMCB)
--------
Index descriptions
EMGB - ICE BofA Emerging Markets External Sovereign Index tracks the performance of US dollar and euro denominated emerging markets sovereign debt publicly issued in the major domestic and eurobond markets. Qualifying securities must have risk exposure to countries other than members of the FX-G10, all Western European countries and territories of the US and Western European countries.
EMCB - ICE BofA Emerging Markets Corporate Plus Index tracks the performance of the US dollar and euro denominated emerging markets non-sovereign debt publicly issued in the major domestic and eurobond markets. Qualifying issuers must have risk exposure to countries other than members of the FX G10, all Western European countries, and territories of the US and Western European countries.
EMIB - ICE BofA High Grade Emerging Markets Corporate Plus Index is a subset of the ICE BofA ML Emerging Markets Corporate Plus Index (EMCB) including all securities rated AAA through BBB3, inclusive.
EMHB - ICE BofA High Yield Emerging Markets Corporate Plus Index is a subset of the ICE BofA ML Emerging Markets Corporate Plus Index (EMCB) including all securities rated BB1 or lower.
Q690 - ICE BofA Custom Emerging Markets Short Duration Index tracks the performance of short-term US dollar and euro denominated emerging markets non-sovereign debt publicly issued in the major domestic and eurobond markets.
EMRA - ICE BofA Asia Emerging Markets Corporate Plus Index is the subset of the ICE BofAML Emerging Markets Corporate Plus Index, which includes only securities issued by countries associated with the region of Asia, excluding Kazakhstan, Kyrgyzstan, Tajikistan, Turkmenistan, and Uzbekistan.
EMHA – The ICE BofA High Yield Asia Emerging Markets Corporate Plus Index is a subset of ICE BofA Emerging Markets Corporate Plus Index including all securities rated BB1 and lower with a country of risk within the Asia region.
EMIA - The ICE BofA High Grade Asia Emerging Markets Corporate Plus Index is a subset of ICE BofA Emerging Markets Corporate Plus Index including all securities rated BBB3 and higher with a country of risk within the Asia region.
EMRL - ICE BofA Latin America Emerging Markets Corporate Plus Index is a subset of The ICE BofA Emerging Markets Corporate Plus Index including all securities issued by countries associated with the geographical region of Latin America.
EMIL - The ICE BofA High Grade Latin America Emerging Markets Corporate Index is a subset of ICE BofA Emerging Markets Corporate Plus Index including all securities rated BBB3 and higher with a country of risk within the Latin America region.
EMHL - ICE BofA High Yield Latin America Emerging Markets Corporate Plus is a subset of ICE BofA Emerging Markets Corporate Plus Index including all securities rated sub-investment grade based on the average of Moody's, S&P and Fitch, and with a country of risk associated with the geographical region of Latin America.
EMRE - ICE BofA EMEA Emerging Markets Corporate Plus Index is a subset of The ICE BofA Emerging Markets Corporate Plus Index including all securities issued by countries associated with the geographical region of Europe, the Middle East and Africa including Kazakhstan, Kyrgyzstan, Tajikistan, Turkmenistan and Uzbekistan.
EMIE - ICE BofA High Grade EMEA Emerging Markets Corporate Plus Index is a subset of ICE BofA Emerging Markets Corporate Plus Index including all securities rated BBB3 and higher with a country of risk within the Europe, Middle East and Africa regions.
EMHE - ICE BofA High Yield EMEA Emerging Markets Corporate Plus Index is a subset of ICE BofA Emerging Markets Corporate Plus Index including all securities rated BBB3 and higher with a country of risk within the Europe, Middle East and Africa regions.
The MSCI EM Index is a free-float weighted equity index that captures large and mid cap representation across emerging market countries. The index covers approximately 85% of the free float-adjusted market capitalisation in each country.
LDMP - ICE BofA Local Debt Markets Plus Index is designed to track the performance of emerging markets sovereign debt publicly issued and denominated in the issuer's own currency.
J0A0 - The ICE BofA ML US Cash Pay High Yield Index tracks the performance of US dollar denominated below investment grade corporate debt, currently in a coupon paying period that is publicly issued in the US domestic market.
C0A0 - The ICE BofA ML US Corporate Index tracks the performance of US dollar denominated investment grade corporate debt publicly issued in the US domestic market.
HE00 - The ICE BofA ML Euro High Yield Index tracks the performance of EUR dominated below investment grade corporate debt publicly issued in the euro domestic or eurobond markets.
ER00 – The ICE BofA ML Euro Corporate Index tracks the performance of EUR denominated investment grade corporate debt publicly issued in the eurobond or Euro member domestic markets.
ICE BofA High Yield Emerging Markets Corporate Plus India Issuers Index (EINH) - is a subset of ICE BofA Emerging Markets Corporate Plus Index including all securities with India as the country of risk that are rated sub-investment grade based on average of Moody's, S&P and Fitch
ADOL -The ICE BofA Asian Dollar Index tracks the performance of U.S. dollar denominated sovereign, quasi-government, corporate, securitized and collateralized debt publicly issued in the U.S. domestic and eurobond markets by Asian issuers.
ADHY - ICE BofA Asian Dollar High Yield Index tracks the performance of sub-investment grade U.S. dollar denominated sovereign, quasi-government, corporate, securitized and collateralized debt publicly issued in the U.S. domestic and eurobond markets by Asian issuers.
ADIG - ICE BofA Asian Dollar Investment Grade Index tracks the performance of investment grade U.S. dollar denominated sovereign, quasi-government, corporate, securitized and collateralized debt publicly issued in the U.S. domestic and eurobond markets by Asian issuers. Qualifying securities have a country of risk classified as an Emerging Markets country that is part of the Asia/Pacific Region.
CEMBI Broad Div. Index - The JP Morgan CEMBI Broad Diversified Index (CEMBIB Div) is a benchmark that tracks the performance of US dollar-denominated, fixed and floating-rate debt instruments issued by emerging market corporate entities.
JESG CEMBI Broad Div. Index - The JP Morgan ESG CEMBI Broad Diversified Custom Maturity Index tracks liquid, US Dollar denominated emerging market fixed and floating-rate debt instruments issued by corporates.
EM3B – ICE BofA BB Emerging Markets Corporate Plus Index is a subset of the ICE BofA Emerging Markets Corporate Plus Index including ass securities rated BB1 through BB3, inclusive.
EMCS – ICE BofA Emerging Markets Corporate Plus Consumer Index is a subset of ICE BofA Emerging Markets Corporate Plus Index including all securities of Consumer Cyclical and Consumer Non-Cyclical issuers.
EMEN – ICE BofA Emerging Market Corporate Plus Energy Index is a subset of ICE BofA Emerging Markets Corporate Plus Index including all securities of Energy issuers.
EMRB – ICE BofA Emerging Market Corporate plus Real Estate, Building & Hotels Index is a subset of ICE BofA Emerging Markets Corporate Plus Index including all securities of Real Easte, Building & Construction, or Hotels.
EMCG – ICE BofA Emerging Markets Corporate Plus Capital Goods Index is a subset of ICE BofA Emerging Markets Corporate Plus Index including all securities of Capital Goods Issuers.
EMSD – ICE BofA Emerging Markets Diversified Corporate Index tracks the performance of USD dollar denominated emerging markets corporate senior and secured debt publicly issued in the US domestic and eurobond markets.
EMTM – ICE BofA Emerging Markets Corporate Plus Media & Telecommunications Index is a subset of ICE BofA Emerging Markets Corporate Plus index including all securities of media and telecommunications issuers.
EM2B – ICE BofA BBB Emerging Markets Corporate Plus Index is a subset of the ICE BofA Emerging Market Corporate Plus index including all securities rated BBB1 through BBB3, inclusive.
EMUT – the ICE BofA Emerging Markets Corporate Plus Utility Index is a subset of the ICE BofA Emerging Markets Corporate Plus Index including all securities of Utility issuers.
EMPB – ICE BofA Public Sector Issuers Emerging Markets Corporate Plus Index is a subset of The BofA Emerging Markets Corporate Plus Index including all quasi-government securities as well as debt of corporate issuers deemed to be government owned or controlled.
ACIG – ICE BofA Asian Dollar Investment Grade Corporate Index tracks the performance of investment grade US dollar denominated securities issued by Asian corporate issuers in the US domestic and eurobonds market. Qualyfying securities have a country of risk associated with Bangladesh, Bhutan, Cambodia, China, John Kong, India, Indonesia, Laos, Macau, Malaysia, Mongolia, Myanmar, Nepal, Pakistan, Papua New Guinea, Philippines, Singapore, South Korea, Sri Lanka, Taiwan, Thailand and Vietnam.
EMAB – Ice BofA Automotive & Basic Industry Emerging Markets Corporate Plus Index is a subset of the ICE BofA Emerging Markets Corporate Plus Index.
EMHE - The ICE BofA High Yield EMEA Emerging Markets Corporate Plus Index is a subset of ICE BofA Emerging Markets Corporate Plus Index including all securities rated BBB3 and higher with a country of risk within the Europe, Middle East and Africa regions.
EMNS – The ICE BofA Non-Financial Emerging Markets Corporate Plus Index is a subset of the ICE BofA Emerging Markets Corporate Plus Index excluding all financial securities as well as debt of corporate issuers designated as government owned or controlled by ICE BofA emerging markets credit research.
EM1B – the ICE BofA AAA-A Emerging Markets Corporate Plus Index is a subset of the ICE BofA Emerging Market Corporate Plus Index including all securities rated AAA through A3, inclusive.
EMFN – EM Corporate Plus Financial is a subset of ICE BofA Emerging Markets Corporate Plus Index including all securities of financial issuers.
EMIE - The ICE BofA High Grade EMEA Emerging Markets Corporate Plus Index is a subset of ICE BofA Emerging Markets Corporate Plus Index including all securities rated BBB3 and higher with a country of risk within the Europe, Middle East and Africa regions.
EM4B – ICE BofA B & Lower Emerging Markets Corporate Plus Index is a subset of the ICE BofA Emerging Markets Corporate Plus Index.
EMRT – ICE BofA Emerging Markets Corporate Plus Transportation Index is a subset of ICE BofA Emerging Markets Corporate Plus Index including all securities of Transportation issuers other than airlines or railroads.
GSFCI - The Goldman Sachs Financial Conditions Index is a measure that assesses the overall financial conditions in the economy, taking into account various factors such as interest rates, credit spreads, and equity prices.
You cannot invest directly in an index, which also does not take into account trading commissions or costs. Additionally, indices do not include reinvestment of dividends, and the volatility of indices may be materially different over time.
Important information
Muzinich and/or Muzinich & Co. referenced herein is defined as Muzinich & Co., Inc. and its affiliates. Muzinich views and opinions. This material has been produced for information purposes only and as such the views contained herein are not to be taken as investment advice. Opinions are as of date of publication and are subject to change without reference or notification to you. Past performance is not a reliable indicator of current or future results and should not be the sole factor of consideration when selecting a product or strategy. The value of investments and the income from them may fall as well as rise and is not guaranteed and investors may not get back the full amount invested. Rates of exchange may cause the value of investments to rise or fall.
Any research in this document has been obtained and may have been acted on by Muzinich for its own purpose. The results of such research are being made available for information purposes and no assurances are made as to their accuracy. Opinions and statements of financial market trends that are based on market conditions constitute our judgment and this judgment may prove to be wrong. The views and opinions expressed should not be construed as an offer to buy or sell or invitation to engage in any investment activity, they are for information purposes only.
This discussion material contains forward-looking statements, which give current expectations of future activities and future performance. Any or all forward-looking statements in this material may turn out to be incorrect. They can be affected by inaccurate assumptions or by known or unknown risks and uncertainties. Although the assumptions underlying the forward-looking statements contained herein are believed to be reasonable, any of the assumptions could be inaccurate and, therefore, there can be no assurances that the forward-looking statements included in this discussion material will prove to be accurate. In light of the significant uncertainties inherent in the forward-looking statements included herein, the inclusion of such information should not be regarded as a representation that the objectives and plans discussed herein will be achieved. Further, no person undertakes any obligation to revise such forward-looking statements to reflect events or circumstances after the date hereof or to reflect the occurrence of unanticipated events.
United States: This material is for Institutional Investor use only – not for retail distribution. Muzinich & Co., Inc. is a registered investment adviser with the Securities and Exchange Commission (SEC). Muzinich & Co., Inc.’s being a Registered Investment Adviser with the SEC in no way shall imply a certain level of skill or training or any authorization or approval by the SEC.
Issued in the European Union by Muzinich & Co. (Ireland) Limited, which is authorized and regulated by the Central Bank of Ireland. Registered in Ireland, Company Registration No. 307511. Registered address: 32 Molesworth Street, Dublin 2, D02 Y512, Ireland. Issued in Switzerland by Muzinich & Co. (Switzerland) AG. Registered in Switzerland No. CHE-389.422.108. Registered address: Tödistrasse 5, 8002 Zurich, Switzerland. Issued in Singapore and Hong Kong by Muzinich & Co. (Singapore) Pte. Limited, which is licensed and regulated by the Monetary Authority of Singapore. Registered in Singapore No. 201624477K. Registered address: 6 Battery Road, #26-05, Singapore, 049909. Issued in all other jurisdictions (excluding the U.S.) by Muzinich & Co. Limited. which is authorized and regulated by the Financial Conduct Authority. Registered in England and Wales No. 3852444. Registered address: 8 Hanover Street, London W1S 1YQ, United Kingdom. 2025-10-02-17061

By clicking "Submit", I am (i) signing up to receive the Opinion Pieces from the "Opinions" page of the Muzinich & Co website, (ii) representing that the above information is true and accurate and (iii) agreeing to join the Muzinich & Co mailing list. I understand that Muzinich & Co will not add retail investors or individuals with personal email addresses to its mailing list and represent that I am not a retail investor. By providing my personal and professional information I am consenting to its use and disclosure in accordance with the Muzinich & Co. Privacy Policy. I understand that I may withdraw my consent and unsubscribe from receiving future communications by clicking "Unsubscribe" from the emails that are sent to me from Muzinich & Co.