Icebreaker
EM Monthly
April 21, 2026
If you have any feedback on this article or are interested in subscribing to our content, please contact us at opinions@muzinich.com or fill out the form on the right hand side of this page.
--------
Geopolitical shockwaves from the Iran conflict have exposed the Middle East to a severe stress test. But, beneath the surface, the region’s sovereign balance sheets, investor base and history of coordinated support suggest a resilience that sets it apart, positioning it more as an “icebreaker” than a casualty of tightening financial conditions, argues Warren Hyland
The old cliché "a rising tide lifts all boats - a falling one reveals the rocks" holds particularly true in financial markets, with wreckage invariably as a result of the thinnest hulls, i.e. weak balance sheets.
In credit markets, the sequence of events tends to follow a recognisable, if not always identical, pattern: financial conditions tighten abruptly, exposing the weakest borrowers to mounting strain as economic conditions deteriorate, liquidity evaporates and funding channels close. The thinnest hulls tend to be found in sovereign frontier markets, corporate issuers in the B/CCC rating buckets and companies operating in highly cyclical, price-taking or growth-sensitive sectors.
For the Middle East, the tide is firmly out - and likely to remain so for as long as the US and Israeli military operations against Iran continue. The closure of the Strait of Hormuz has choked key trade arteries, dislocating the flow of goods, energy prices and volumes. Meanwhile, Iran’s opportunistic retaliation against US military and critical infrastructure targets across the region has further unsettled investors, curtailing capital flows and bringing tourism to a halt. This leads us to the critical question: how strong, and how thick, are the region’s hulls?
What follows is a hull inspection, assessing each country’s seaworthiness across four key dimensions: geographic exposure to supply chain disruption; historical willingness to repay bondholders under stress; the likely composition of the investor base; and the underlying strength and sustainability of each sovereign’s credit fundamentals.
Geography- winner and losers
Higher energy prices generally benefit the Middle East, given its major economies are closely tied to hydrocarbon production. However, the extent of this is highly dependent on geography and export infrastructure, particularly if the Strait of Hormuz is closed. Based on reliance to this critical waterway, the region’s sovereigns can be broadly grouped into three categories: unaffected, partially affected and heavily affected.
Unaffected countries include Oman, whose export facilities bypass the Strait of Hormuz. Israel is similarly insulated, with the development of offshore gas fields having transformed it into a net natural gas exporter. However, Israel is clearly a target for Iranian retribution, and infrastructure cannot be guaranteed. Jordan and Egypt also fall into this category as net energy importers, although this leaves them vulnerable to a deterioration in fiscal and external balances if energy prices remain elevated for a prolonged period. Furthermore, Jordan is most sensitive to fluctuations in tourism, which accounts for nearly one-third of current account receipts.1
The UAE and Saudi Arabia are partially affected. Abu Dhabi's crude oil pipeline to Fujairah can route roughly 50% of the emirate's oil exports directly to the Indian Ocean, bypassing the Strait of Hormuz entirely.2 Saudi Arabia, that exports around 6.5 mb/d of crude oil, over 80% (approximately 5.2 mb/d) typically transit the Strait.3 However, the East-West Pipeline provides a viable alternative, with an estimated 3.3 mb/d of spare capacity that could help sustain export flows in the event of disruption.1
That said, the protection of critical infrastructure from Iranian offensive action remains paramount in keeping both nations within the partially affected camp. The UAE is also home to the US Al Dhafra Air Base, which is a designated target.
The heavily affected camp includes Iraq, Kuwait, Bahrain and Qatar, all of which rely almost entirely on the Strait for exports. Bahrain is partially cushioned by a diversified economy, around 80% non-oil. However, with roughly 75% of government revenues still oil-dependent, a prolonged disruption would drive significant fiscal deterioration.4 Its hosting of the US Navy’s Fifth Fleet also makes it a strategic target.
Qatar can partially mitigate risks via the Dolphin Pipeline, although this accounts for only around 7% of gas exports.5 It also hosts Al Udeid Air Base, the largest US military installation in the region, making it a clear target for Iran. These risks have already materialised, with Iranian strikes on the Ras Laffan industrial complex on 4 March 2026 forcing Qatar Energy to declare force majeure and halt liquid natural gas (LNG) production and exports.6
Figure 1 – Strait of Hormuz
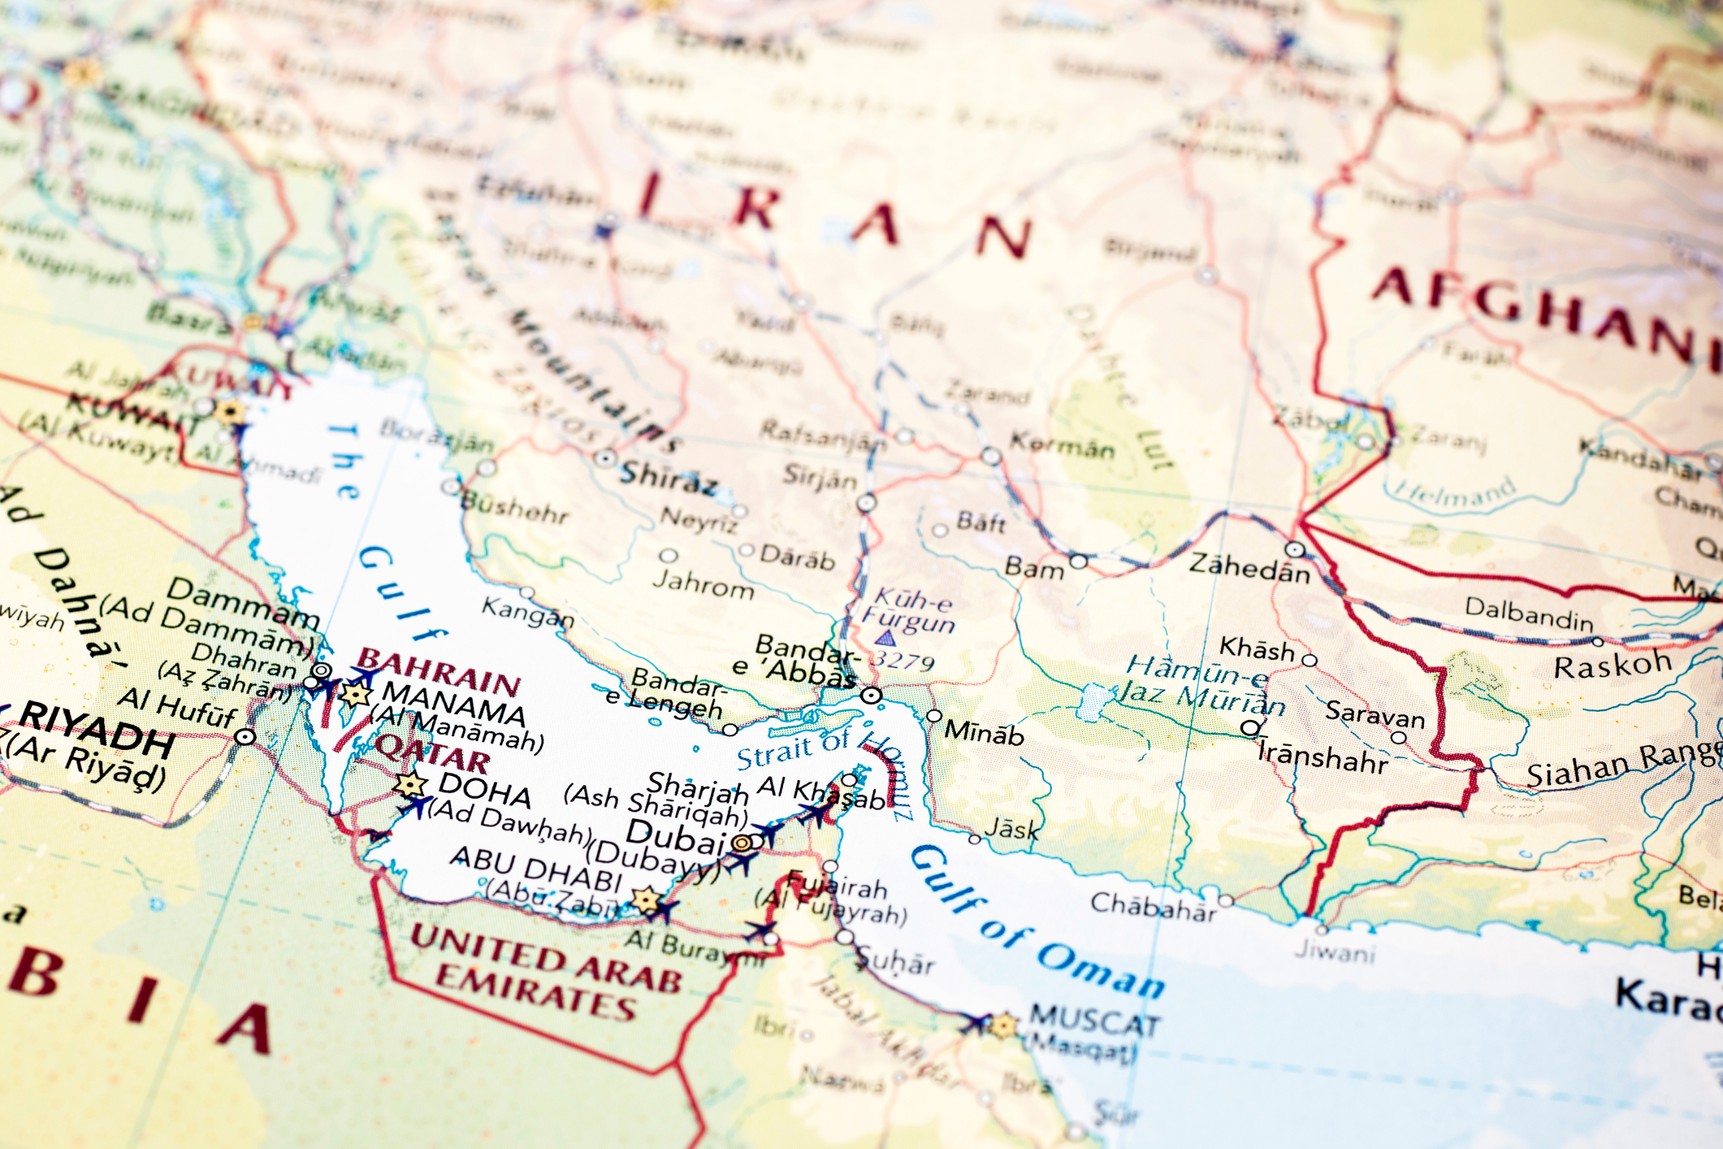
Sources: iStock, as of 14th April 2026. For illustrative purposes only.
Willingness - absolute
A common test applied by investors is to review historical periods of stress and the track record of defaults. That is, whether sovereigns have demonstrated a willingness to support and honour their debt obligations, or preferred restructuring.
Sovereign defaults in the Middle East are relatively rare compared to other emerging market (EM) regions but are not without precedent. The only recent case is Lebanon, which recorded its first-ever sovereign default in March 2020.7 The default was driven by unsustainable debt levels exceeding 170% of GDP, compounded by a catastrophic collapse of the banking sector and a political system too dysfunctional to enact meaningful reform.
Iraq underwent a debt restructuring in 2004 following the Gulf War sanctions era, achieving an 80% debt reduction through the Paris Club.8 This was not a conventional market default in the traditional sense – it was more a consequence of war and prolonged sanctions. Prior to that we need to go back to the 19th century, when heavy government borrowing culminated in defaults on foreign obligations by the Ottoman Empire in 1875 and Egypt in 1876.9
While defaults are rare, the willingness of Gulf Cooperation Council (GCC) members to provide regional support is both strong and well established. Bahrain offers two clear examples. In 2011, triggered by the Arab Spring, the GCC intervened militarily through its Peninsula Shield Force, deploying Saudi troops and UAE police to suppress the uprising and protect the regime, while simultaneously providing a US$10 billion financial support package for infrastructure and housing development.10 Oman also received an equivalent US$10 billion package under the same programme.9 However, by 2018, Bahrain's situation had deteriorated, resembling a classic fiscal crisis - debt had risen to 89% of GDP and international reserves had plunged to just US$1.5 billion, barely one month of imports. This led Saudi Arabia, Kuwait and the UAE to intervene with a US$10 billion bailout.11
Further evidence of the region’s strong and consistent willingness to provide support can be seen in numerous interventions in Egypt. Following the Arab Spring, and again at the onset of the Ukraine war, GCC countries extended substantial financial assistance. The most dramatic came in early 2024, when the UAE’s Ras Al Khaimah (Ras Al-Hikma) deal secured an estimated US$24 billion in new dollar inflows, alongside the waiver of US$11 billion in existing UAE deposits at the Central Bank of Egypt.12 In total, GCC support to Egypt has reached approximately US$114 billion over the past decade.13
Investor base - high quality
Our core thesis is that global asset allocators remain meaningfully underweight EM fixed income. This view is underpinned by persistent outflows from the asset class between 2022 and mid-2025, a stark contrast to developed market credit, which attracted sustained inflows from 2023 onwards.14 A notable consequence of this dynamic is that ownership has migrated toward stickier domestic investors. New issue allocations to Middle Eastern domestic accounts rose from 39% to 55% in 2024, reflecting a structural shift in the buyer base.13
JP Morgan's positioning analysis suggests European investors carry marginally greater Middle East exposure than their US counterparts, though only European high yield funds hold allocations above 1% (Figure 2). Among dedicated EM funds, exposure is estimated at just 7%, well below benchmark weight.
Figure 2 – Investor positioning in the Middle East
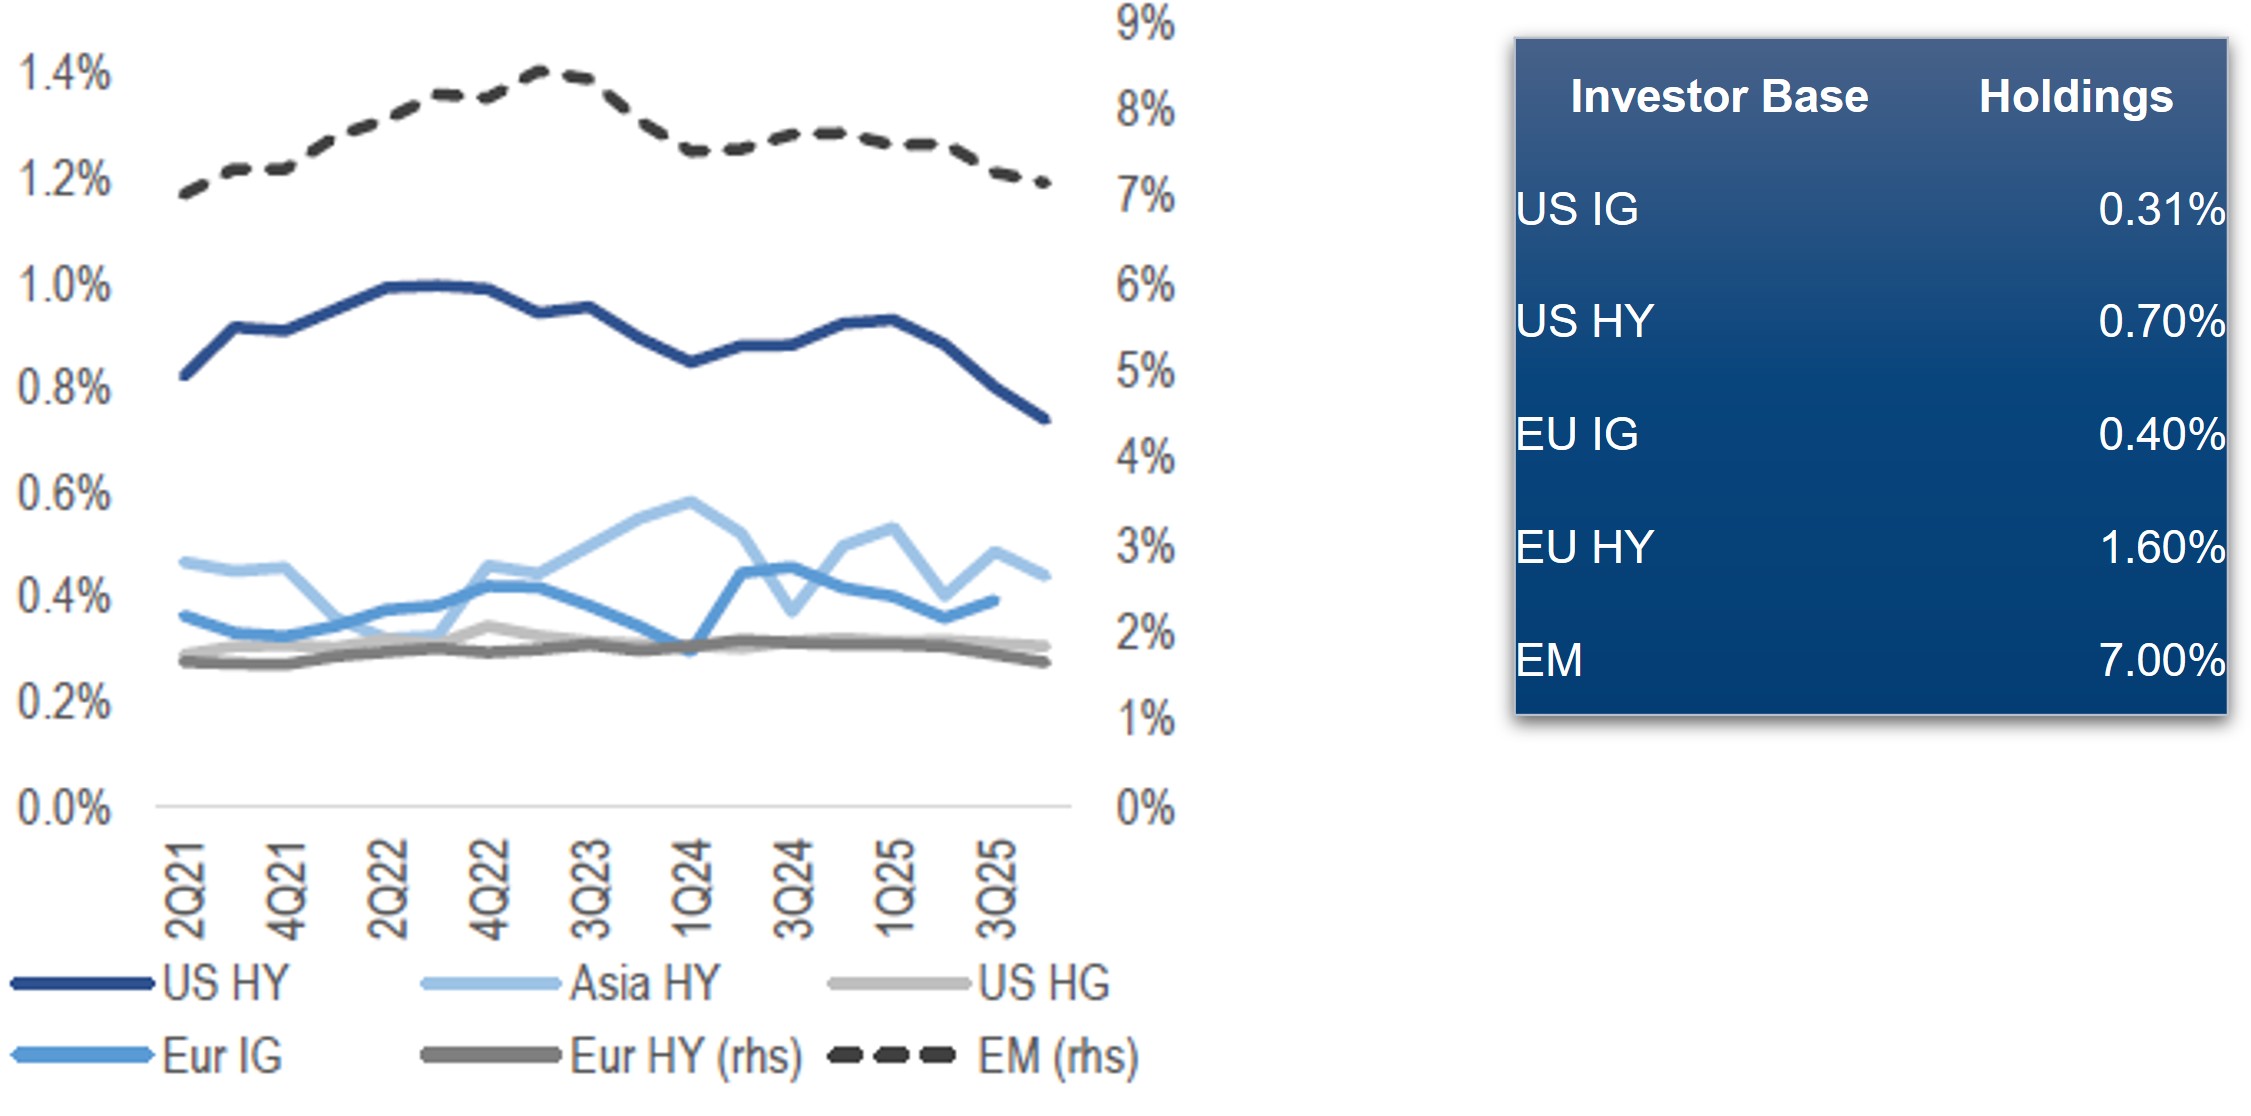
Source: JP Morgan Global Credit Research, as of March 2026. Emerging markets corporate strategy: staying the course amidst disruptive winds from AI concerns and geopolitical risk. For illustrative purposes only.
For ETF and benchmark-oriented strategies, we reference the ICE BofA indexes, which may diverge from the JP Morgan index suite. Within this framework, Saudi Arabia and UAE represent the two largest sovereign and corporate index weights, each exceeding 8% (Figure 3). Both are A-rated sovereigns with minimal high yield corporate exposure. Within the sovereign index, the most meaningful high yield exposure is Egypt at 1.9%, while in the corporate index, Israel high yield accounts for approximately 1%.
Figure 3 - Benchmark weighting for sovereign and corporate EM indexes
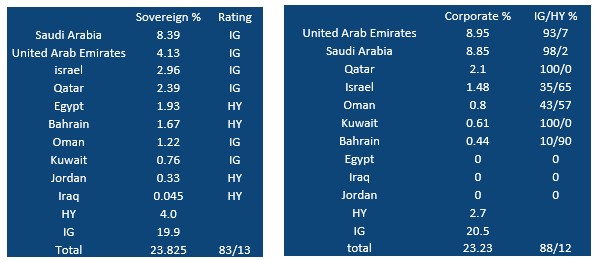
Source: ICE Index platform, as of 13th April 2026. ICE BofA Emerging Markets External Sovereign Index (EMGB), ICE BofA Emerging Markets Corporate Liquid Index (EMCL). For illustrative purposes only.
Credit fundamentals - robust
We evaluate sovereign balance sheets through four dimensions of vulnerability. First, the sovereign's credit trajectory, using S&P Global’s credit rating activity and outlook changes as a real-time barometer of perceived creditworthiness. A downgrade would be a warning, a sign that vulnerability is rising.
Next, we evaluate the ability for domestic investment to be sustainable, measured through the saving-investment gap. This reveals the degree to which each economy relies on foreign capital to fund investment, a negative number highlights the need for foreign capital.
Thirdly, we assess banking system robustness using the S&P Global Banking Industry Country Risk Assessment (BICRA) framework. BICRA evaluates and compares the relative strength of banking systems across the globe on a scale of 1 to 10, where group 1 represents the lowest risk - though no banking system has ever achieved this score. To contextualise the scale, Switzerland sits at 2, the US at 3, Italy at 4 and Greece at 5 among developed economies.15
Finally, we assess sovereign indebtedness; debt above 100% is treated as unsustainable, although there is no universally agreed threshold, and liquidity needs through the ratio of external funding over the next 12 months relative to current account receipts. A ratio of 100 -150% is considered adequate, although it signals refinancing risk. A ratio above 150% is considered weak, indicative of significant rollover dependency and heightened vulnerability to a sudden loss of market access.
Figure 4 ranks sovereigns from left to right in ascending order of credit strength, with the strongest fundamental profiles positioned to the far right. Red shading denotes negative attributes while green denotes positive ones.
Figure 4 – Sovereign fundamental credit matrix
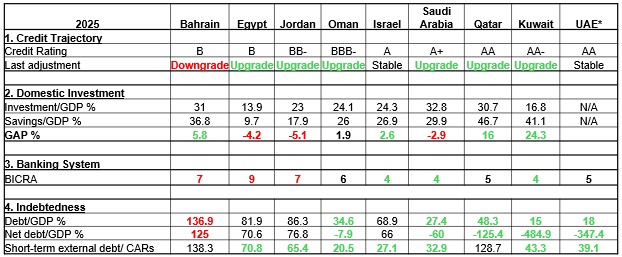
Source: Muzinich internal analysis as of 13th April, based on latest sovereign rating from S&P Global Ratings. *For UAE used Abu Dhabi financial data. For illustrative purposes only.
The table shows positive (green) indicators outweigh negatives, giving us confidence the region remains robust from a fundamental credit perspective. Bahrain stands out as a relatively weak sovereign due to its rising indebtedness, which has driven recent rating agency downgrades. However, as highlighted in our willingness analysis (above), Bahrain’s access to support from GCC members remains strong and credible. Egypt and Jordan have weaker banking systems and some reliance on external funding to support growth, although this is not yet a material concern. The remaining sovereigns in the table exhibit broadly strong credit profiles.
The Middle East - an ‘Arctic icebreaker’
Following our ‘hull’ inspection, the region passes with flying colours. If we were to characterise it as a vessel, it would be an Arctic icebreaker - renowned for possessing the most reinforced hull among all classes of seafaring ships.
This conclusion is drawn from four converging strengths:
EM look back – March
Past performance is not a reliable indicator of current or future results.
Market Data - Credit
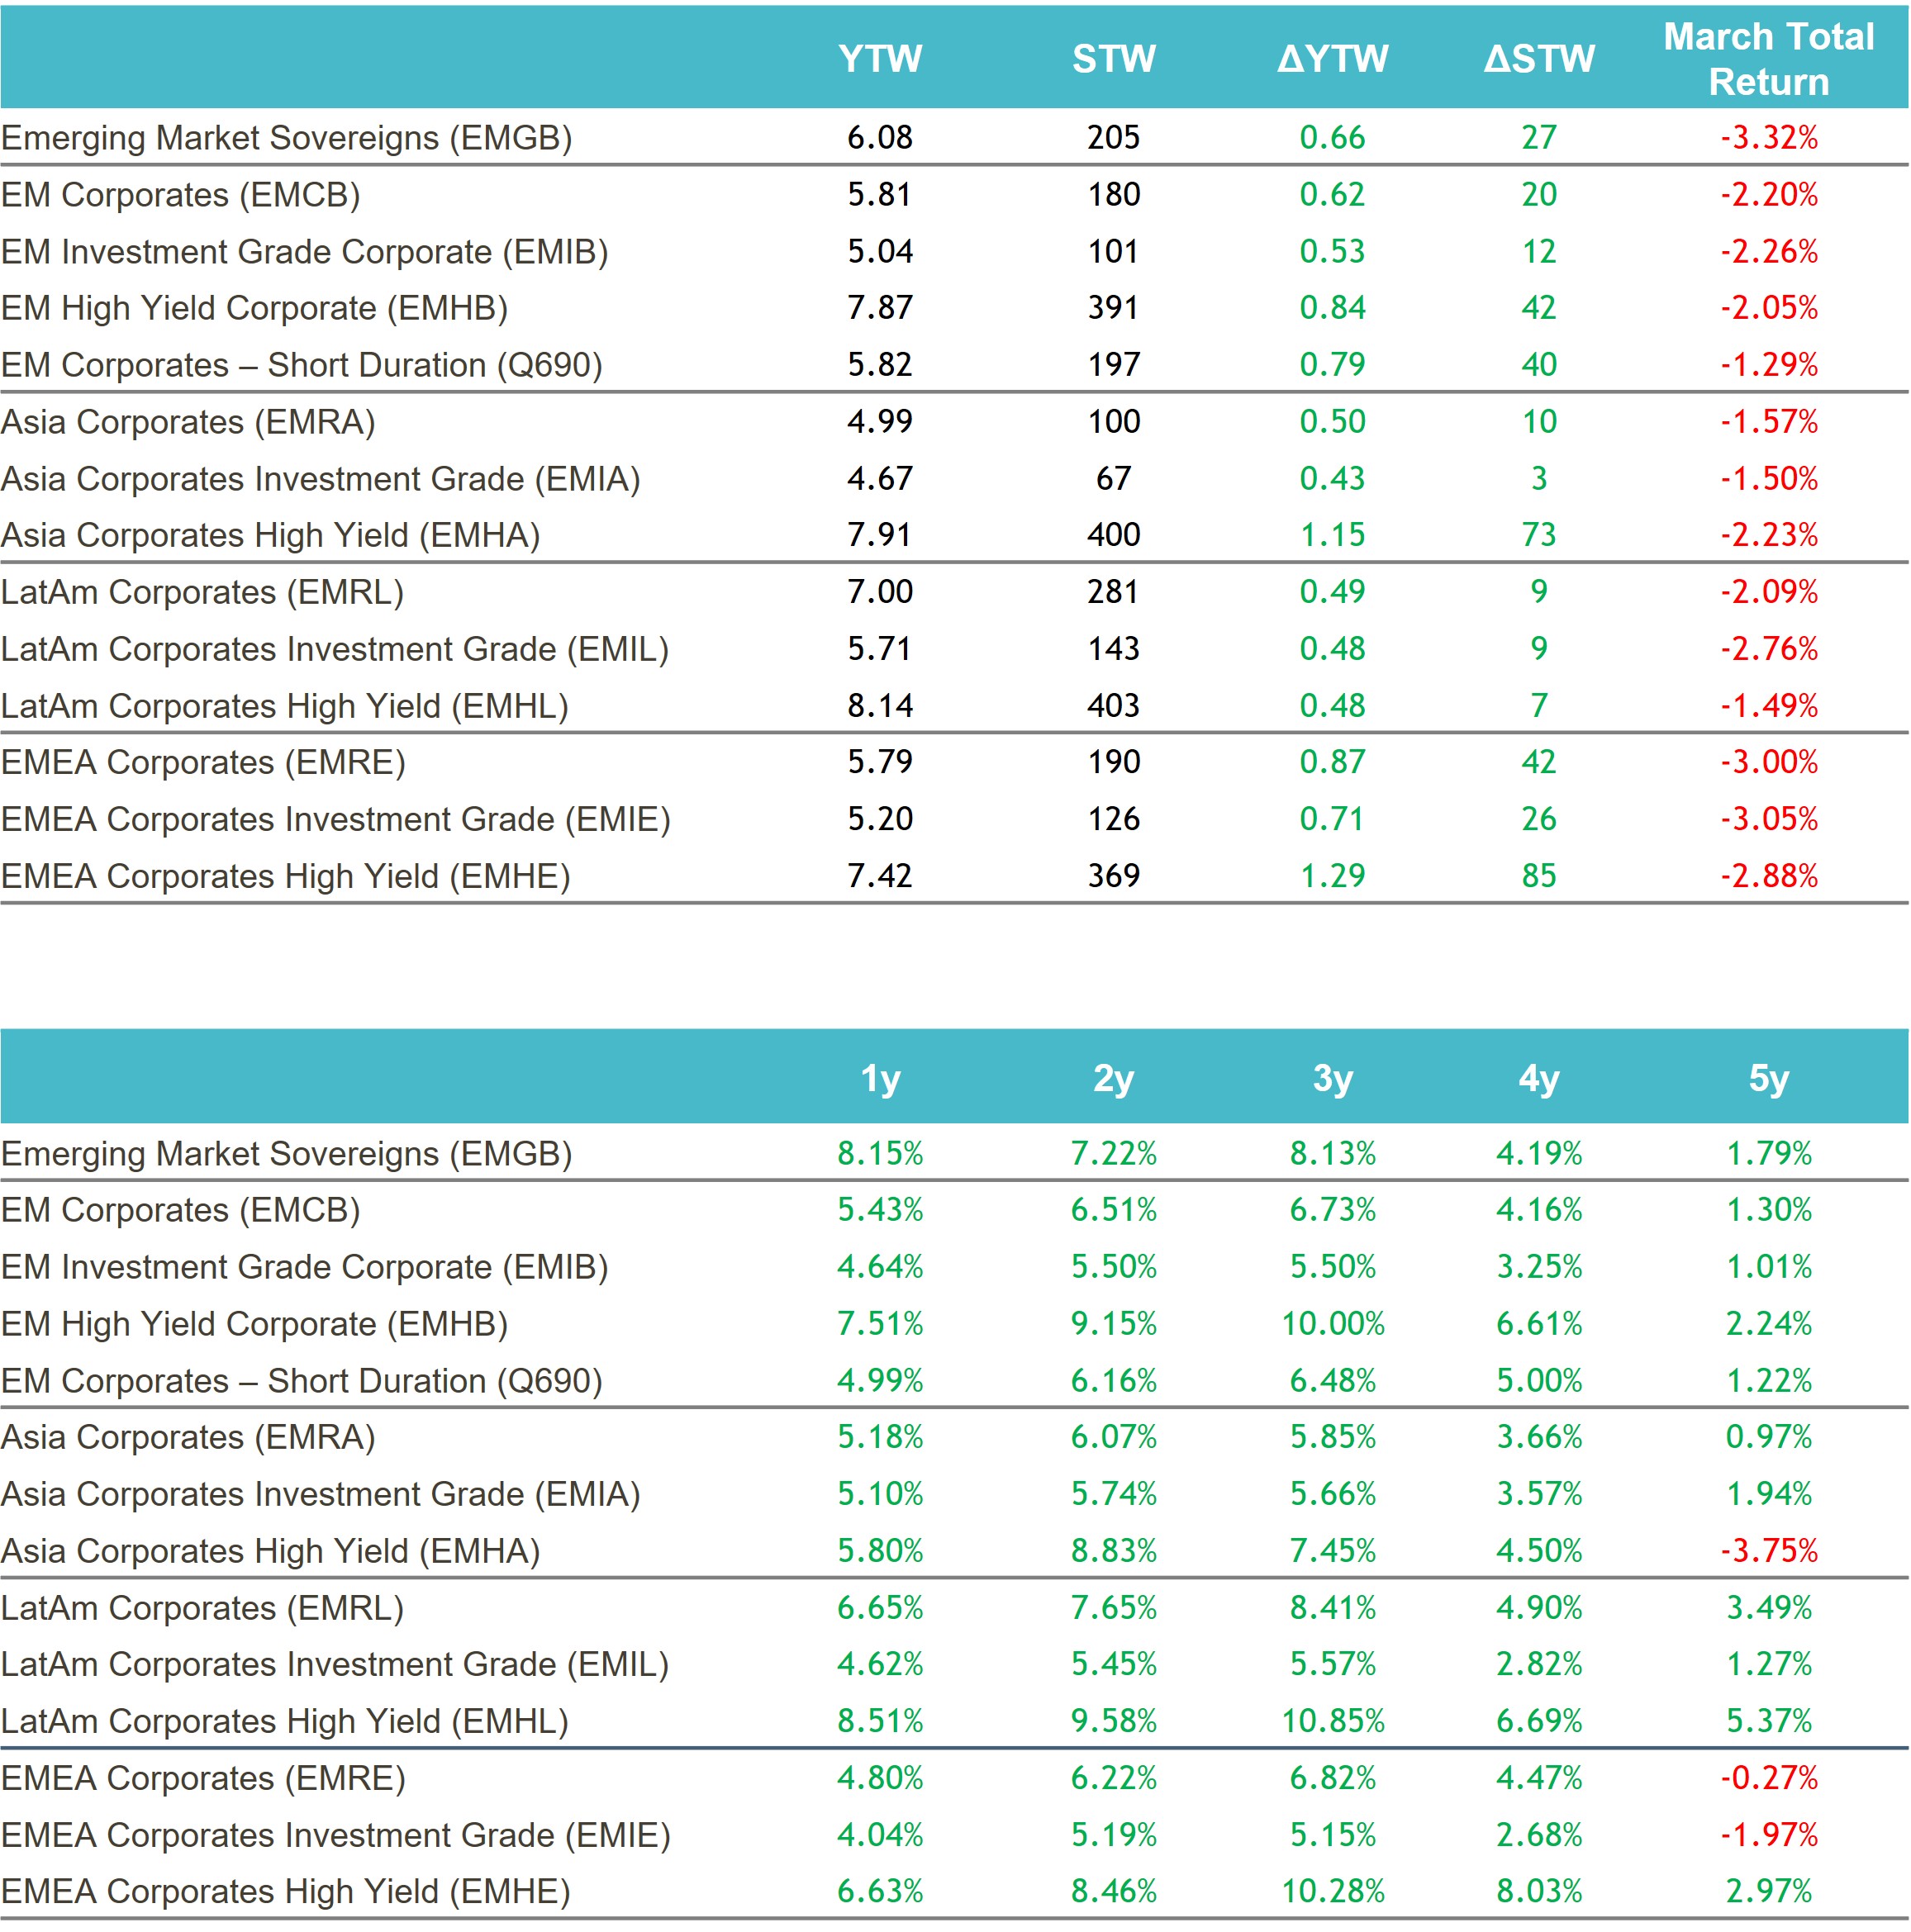
Past performance is not a reliable indicator of current or future results.
Source: ICE data platform. as of 31st March 2026. EMGB - ICE BofA Emerging Markets External Sovereign Index EMCB - ICE BofA Emerging Markets Corporate Plus Index, EMIB - ICE BofA High Grade Emerging Markets Corporate Plus Index, EMHB - ICE BofA High Yield Emerging Markets Corporate Plus Index, Q690 - ICE BofA Custom Emerging Markets Short Duration Index, EMRA - ICE BofA Asia Emerging Markets Corporate Plus Index, EMIA - ICE BofA High Grade Asia Emerging Markets Corporate Plus Index, EMHA - ICE BofA High Yield Asia Emerging Markets Corporate Plus Index , EMRL - ICE BofA Latin America Emerging Markets Corporate Plus Index, EMIL - The ICE BofA High Grade Latin America Emerging Markets Corporate Index, EMHL - ICE BofA High Yield Latin America Emerging Markets Corporate Plus, EMRE - ICE BofA EMEA Emerging Markets Corporate Plus Index, EMIE - ICE BofA High Grade EMEA Emerging Markets Corporate Plus Index, EMHE - ICE BofA High Yield EMEA Emerging Markets Corporate Plus Index,. Index performance is for illustrative purposes only. You cannot invest directly in the index. Indices selected provide best proxy for highlighting performance of emerging market corporate bonds. For illustrative purposes only.
Yield to Worst
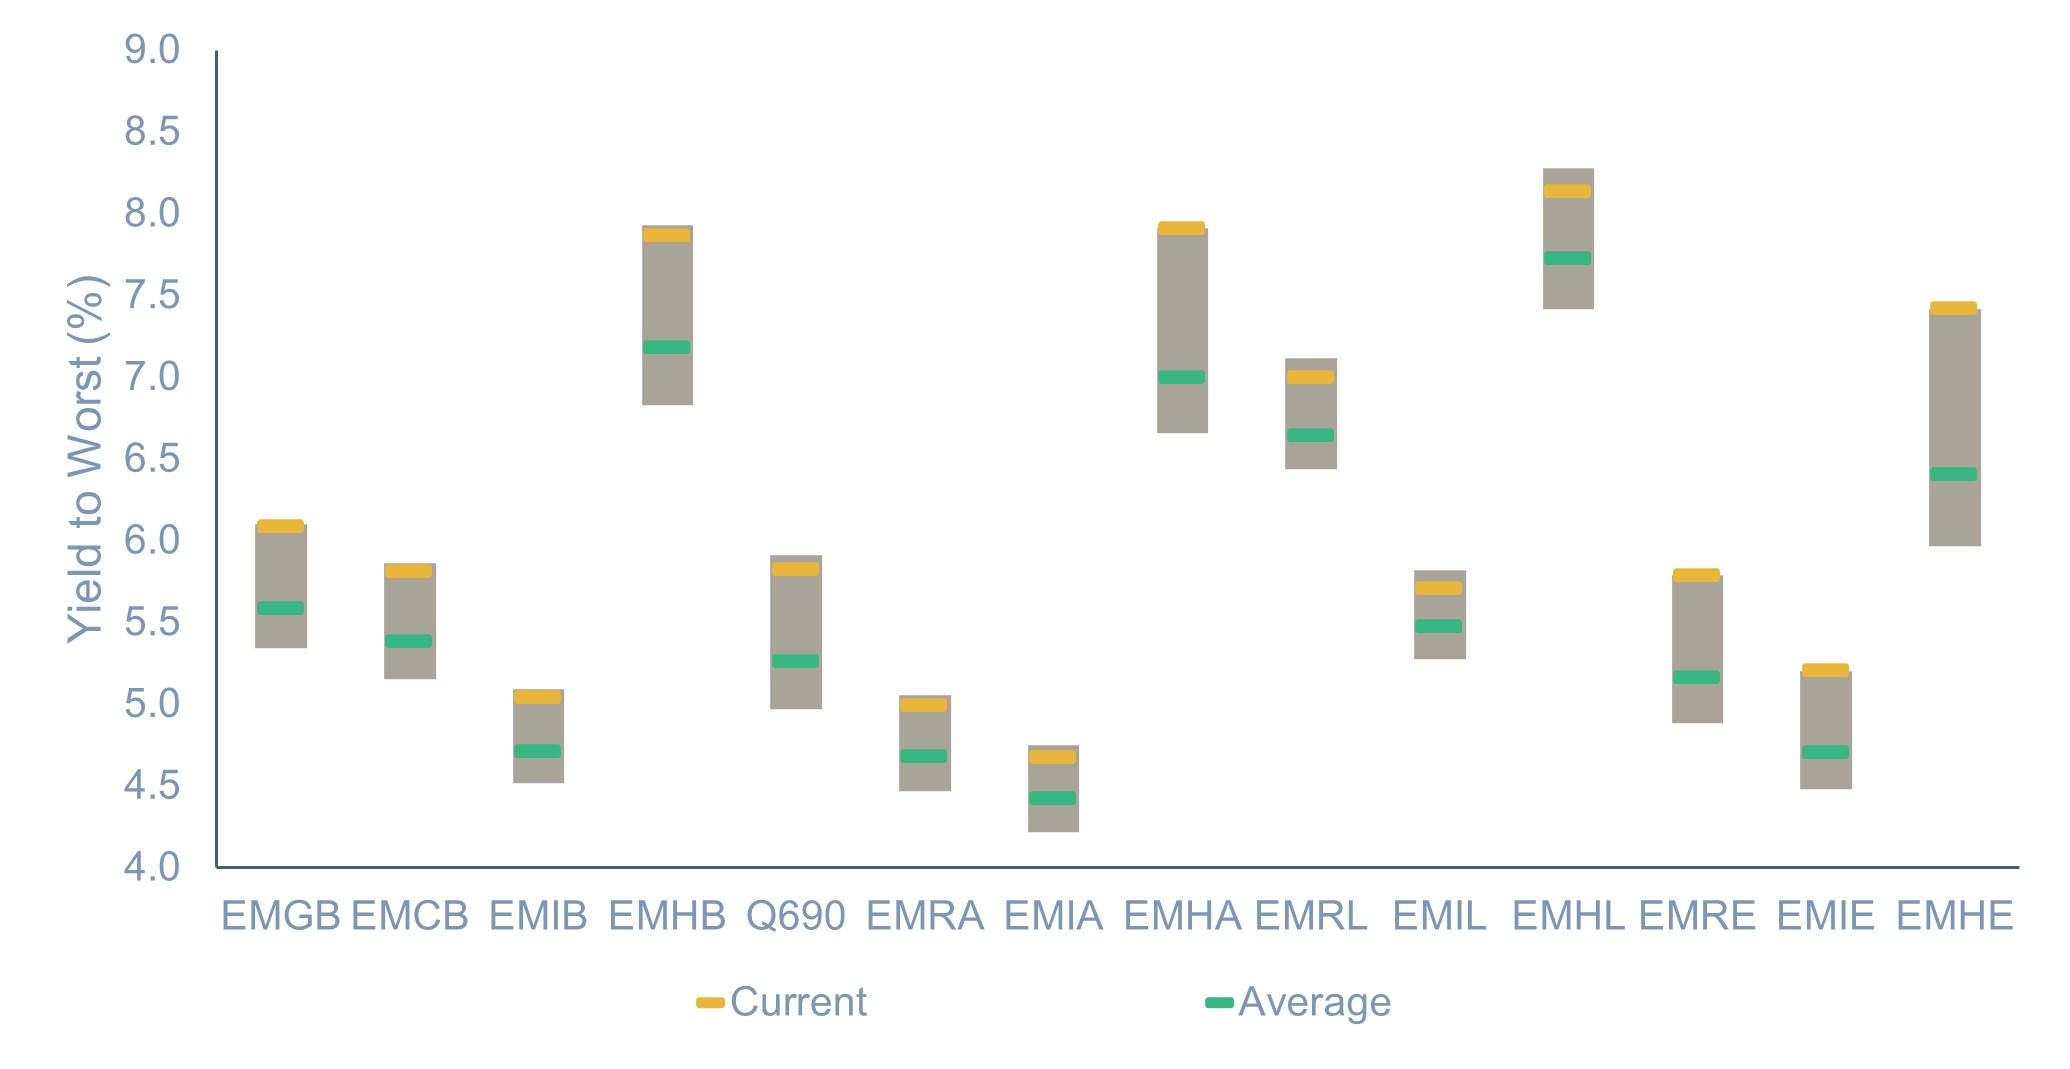 Source: ICE data platform. as of 31st March 2026. EMGB - ICE BofA Emerging Markets External Sovereign Index EMCB - ICE BofA Emerging Markets Corporate Plus Index, EMIB - ICE BofA High Grade Emerging Markets Corporate Plus Index, EMHB - ICE BofA High Yield Emerging Markets Corporate Plus Index, Q690 - ICE BofA Custom Emerging Markets Short Duration Index, EMRA - ICE BofA Asia Emerging Markets Corporate Plus Index, EMIA - ICE BofA High Grade Asia Emerging Markets Corporate Plus Index, EMHA - ICE BofA High Yield Asia Emerging Markets Corporate Plus Index , EMRL - ICE BofA Latin America Emerging Markets Corporate Plus Index, EMIL - The ICE BofA High Grade Latin America Emerging Markets Corporate Index, EMHL - ICE BofA High Yield Latin America Emerging Markets Corporate Plus, EMRE - ICE BofA EMEA Emerging Markets Corporate Plus Index, EMIE - ICE BofA High Grade EMEA Emerging Markets Corporate Plus Index, EMHE - ICE BofA High Yield EMEA Emerging Markets Corporate Plus Index,. Index performance is for illustrative purposes only. You cannot invest directly in the index. Indices selected provide best proxy for highlighting performance of emerging market corporate bonds. For illustrative purposes only.
References
1. S&P Global Ratings, as of 2nd March 2026. “Middle East Conflict is starting to strain credit channels across sectors”
2. S&P Global Ratings, as of 6th March 2026. Emirate of Abu Dhabi ‘AA/A-1+’ ratings affirmed; outlook stable.
3. S&P Global Ratings, as of 13th March 2026. “Ratings on Saudi Arabia Affirmed at ‘A+/A-1’; outlook stable
4. Ministry of Information, Kingdom of Bahrain, Business and Economy, as of April 2026.
5. IEA, as of February 2026. Strait of Hormuz Factsheet.
6. Al Jazeera, as of 2nd March 2026. Gas prices soar as QatarEnergy halts LND production after Iran attacks.
7. Yale school of management, as of 21st September 2020. Part I of crisis in Lebanon: Economic ‘free fall,’ IMF negotiations, and Beirut explosion.
8. IMF, as of 1st March 2010. “Public information notice: IMF Executive Board Concludes 2009 Article IV Consultation with Iraq.”
9. Cambridge University Press, as of 8th October 2021. ‘Impossible to provide an accurate estimate’: the interested calculation of the Ottoman public debt, 1875-1881.
10. The National News, as of 11th March 2011, GCC to set up US$20bn bailout fund for Bahrain and Oman.
11. Middle East Institute, as of 30th October, 2018. The politics of aid: GCC support for Bahrain
12. PWC, as of March 2024. Egypt’s economy achieves a turnaround with UAE support.
13. Fikra Forum, as of 7th June 2022. Aid for security: The Gulf-Egypt Dynamic Supporting Egypt’s Economy.
14. Muzinich & Co, as of 7th October 2025. “Turning of the tide”
15. S&P Global, as of February 2026. Banking Industry Country Risk Assessment Update.
------
Index descriptions
EMGB - ICE BofA Emerging Markets External Sovereign Index tracks the performance of US dollar and euro denominated emerging markets sovereign debt publicly issued in the major domestic and eurobond markets. Qualifying securities must have risk exposure to countries other than members of the FX-G10, all Western European countries and territories of the US and Western European countries.
EMCB - ICE BofA Emerging Markets Corporate Plus Index tracks the performance of the US dollar and euro denominated emerging markets non-sovereign debt publicly issued in the major domestic and eurobond markets. Qualifying issuers must have risk exposure to countries other than members of the FX G10, all Western European countries, and territories of the US and Western European countries.
EMIB - ICE BofA High Grade Emerging Markets Corporate Plus Index is a subset of the ICE BofA ML Emerging Markets Corporate Plus Index (EMCB) including all securities rated AAA through BBB3, inclusive.
EMHB - ICE BofA High Yield Emerging Markets Corporate Plus Index is a subset of the ICE BofA ML Emerging Markets Corporate Plus Index (EMCB) including all securities rated BB1 or lower.
Q690 - ICE BofA Custom Emerging Markets Short Duration Index tracks the performance of short-term US dollar and euro denominated emerging markets non-sovereign debt publicly issued in the major domestic and eurobond markets.
EMRA - ICE BofA Asia Emerging Markets Corporate Plus Index is the subset of the ICE BofAML Emerging Markets Corporate Plus Index, which includes only securities issued by countries associated with the region of Asia, excluding Kazakhstan, Kyrgyzstan, Tajikistan, Turkmenistan, and Uzbekistan.
EMHA – The ICE BofA High Yield Asia Emerging Markets Corporate Plus Index is a subset of ICE BofA Emerging Markets Corporate Plus Index including all securities rated BB1 and lower with a country of risk within the Asia region.
EMIA - The ICE BofA High Grade Asia Emerging Markets Corporate Plus Index is a subset of ICE BofA Emerging Markets Corporate Plus Index including all securities rated BBB3 and higher with a country of risk within the Asia region.
EMRL - ICE BofA Latin America Emerging Markets Corporate Plus Index is a subset of The ICE BofA Emerging Markets Corporate Plus Index including all securities issued by countries associated with the geographical region of Latin America.
EMIL - The ICE BofA High Grade Latin America Emerging Markets Corporate Index is a subset of ICE BofA Emerging Markets Corporate Plus Index including all securities rated BBB3 and higher with a country of risk within the Latin America region.
EMHL - ICE BofA High Yield Latin America Emerging Markets Corporate Plus is a subset of ICE BofA Emerging Markets Corporate Plus Index including all securities rated sub-investment grade based on the average of Moody's, S&P and Fitch, and with a country of risk associated with the geographical region of Latin America.
EMRE - ICE BofA EMEA Emerging Markets Corporate Plus Index is a subset of The ICE BofA Emerging Markets Corporate Plus Index including all securities issued by countries associated with the geographical region of Europe, the Middle East and Africa including Kazakhstan, Kyrgyzstan, Tajikistan, Turkmenistan and Uzbekistan.
EMIE - ICE BofA High Grade EMEA Emerging Markets Corporate Plus Index is a subset of ICE BofA Emerging Markets Corporate Plus Index including all securities rated BBB3 and higher with a country of risk within the Europe, Middle East and Africa regions.
EMHE - ICE BofA High Yield EMEA Emerging Markets Corporate Plus Index is a subset of ICE BofA Emerging Markets Corporate Plus Index including all securities rated BBB3 and higher with a country of risk within the Europe, Middle East and Africa regions.
The MSCI EM Index is a free-float weighted equity index that captures large and mid cap representation across emerging market countries. The index covers approximately 85% of the free float-adjusted market capitalisation in each country.
LDMP - ICE BofA Local Debt Markets Plus Index is designed to track the performance of emerging markets sovereign debt publicly issued and denominated in the issuer's own currency.
J0A0 - The ICE BofA ML US Cash Pay High Yield Index tracks the performance of US dollar denominated below investment grade corporate debt, currently in a coupon paying period that is publicly issued in the US domestic market.
C0A0 - The ICE BofA ML US Corporate Index tracks the performance of US dollar denominated investment grade corporate debt publicly issued in the US domestic market.
HE00 - The ICE BofA ML Euro High Yield Index tracks the performance of EUR dominated below investment grade corporate debt publicly issued in the euro domestic or eurobond markets.
ER00 – The ICE BofA ML Euro Corporate Index tracks the performance of EUR denominated investment grade corporate debt publicly issued in the eurobond or Euro member domestic markets.
ICE BofA High Yield Emerging Markets Corporate Plus India Issuers Index (EINH) - is a subset of ICE BofA Emerging Markets Corporate Plus Index
ADHY - ICE BofA Asian Dollar High Yield Index tracks the performance of sub-investment grade U.S. dollar denominated sovereign, quasi-government, corporate, securitized and collateralized debt publicly issued in the U.S. domestic and eurobond markets by Asian issuers.
ADIG - ICE BofA Asian Dollar Investment Grade Index tracks the performance of investment grade U.S. dollar denominated sovereign, quasi-government, corporate, securitized and collateralized debt publicly issued in the U.S. domestic and eurobond markets by Asian issuers. Qualifying securities have a country of risk classified as an Emerging Markets country that is part of the Asia/Pacific Region.
CEMBI Broad Div. Index - The JP Morgan CEMBI Broad Diversified Index (CEMBIB Div) is a benchmark that tracks the performance of US dollar-denominated, fixed and floating-rate debt instruments issued by emerging market corporate entities.
JESG CEMBI Broad Div. Index - The JP Morgan ESG CEMBI Broad Diversified Custom Maturity Index tracks liquid, US Dollar denominated emerging market fixed and floating-rate debt instruments issued by corporates.
EM3B – ICE BofA BB Emerging Markets Corporate Plus Index is a subset of the ICE BofA Emerging Markets Corporate Plus Index including ass securities rated BB1 through BB3, inclusive.
EMCS – ICE BofA Emerging Markets Corporate Plus Consumer Index is a subset of ICE BofA Emerging Markets Corporate Plus Index including all securities of Consumer Cyclical and Consumer Non-Cyclical issuers.
EMEN – ICE BofA Emerging Market Corporate Plus Energy Index is a subset of ICE BofA Emerging Markets Corporate Plus Index including all securities of Energy issuers.
EMRB – ICE BofA Emerging Market Corporate plus Real Estate, Building & Hotels Index is a subset of ICE BofA Emerging Markets Corporate Plus Index including all securities of Real Easte, Building & Construction, or Hotels.
EMCG – ICE BofA Emerging Markets Corporate Plus Capital Goods Index is a subset of ICE BofA Emerging Markets Corporate Plus Index including all securities of Capital Goods Issuers.
EMSD – ICE BofA Emerging Markets Diversified Corporate Index tracks the performance of USD dollar denominated emerging markets corporate senior and secured debt publicly issued in the US domestic and eurobond markets.
EMTM – ICE BofA Emerging Markets Corporate Plus Media & Telecommunications Index is a subset of ICE BofA Emerging Markets Corporate Plus index including all securities of media and telecommunications issuers.
EM2B – ICE BofA BBB Emerging Markets Corporate Plus Index is a subset of the ICE BofA Emerging Market Corporate Plus index including all securities rated BBB1 through BBB3, inclusive.
EMUT – the ICE BofA Emerging Markets Corporate Plus Utility Index is a subset of the ICE BofA Emerging Markets Corporate Plus Index including all securities of Utility issuers.
EMPB – ICE BofA Public Sector Issuers Emerging Markets Corporate Plus Index is a subset of The BofA Emerging Markets Corporate Plus Index including all quasi-government securities as well as debt of corporate issuers deemed to be government owned or controlled.
ACIG – ICE BofA Asian Dollar Investment Grade Corporate Index tracks the performance of investment grade US dollar denominated securities issued by Asian corporate issuers in the US domestic and eurobonds market. Qualyfying securities have a country of risk associated with Bangladesh, Bhutan, Cambodia, China, John Kong, India, Indonesia, Laos, Macau, Malaysia, Mongolia, Myanmar, Nepal, Pakistan, Papua New Guinea, Philippines, Singapore, South Korea, Sri Lanka, Taiwan, Thailand and Vietnam.
EMAB – Ice BofA Automotive & Basic Industry Emerging Markets Corporate Plus Index is a subset of the ICE BofA Emerging Markets Corporate Plus Index.
EMHE - The ICE BofA High Yield EMEA Emerging Markets Corporate Plus Index is a subset of ICE BofA Emerging Markets Corporate Plus Index including all securities rated BBB3 and higher with a country of risk within the Europe, Middle East and Africa regions.
EMNS – The ICE BofA Non-Financial Emerging Markets Corporate Plus Index is a subset of the ICE BofA Emerging Markets Corporate Plus Index excluding all financial securities as well as debt of corporate issuers designated as government owned or controlled by ICE BofA emerging markets credit research.
EM1B – the ICE BofA AAA-A Emerging Markets Corporate Plus Index is a subset of the ICE BofA Emerging Market Corporate Plus Index including all securities rated AAA through A3, inclusive.
including all securities with India as the country of risk that are rated sub-investment grade based on average of Moody's, S&P and Fitch
ADOL -The ICE BofA Asian Dollar Index tracks the performance of U.S. dollar denominated sovereign, quasi-government, corporate, securitized and collateralized debt publicly issued in the U.S. domestic and eurobond markets by Asian issuers.
ICE BofA China Corporate Index (CN0C) ICE BofA China Corporate Index tracks the performance of CNY denominated corporate debt issued in the Chinese domestic bond market. Qualifying securities must have at least one year remaining term to final maturity, at least 18 months to final maturity at point of issuance, a fixed coupon schedule and a minimum amount outstanding of CNY 500 million. Callable perpetual securities qualify provided they are at least one year from the first call date. Fixed-to-floating rate securities also qualify provided they are callable within the fixed rate period and are at least one year from the last call prior to the date the bond transitions from a fixed to a floating rate security. Contingent capital securities (“cocos”) are excluded, but capital securities where conversion can be mandated by a regulatory authority, but which have no specified trigger, are included. Other hybrid capital securities, such as those issues that potentially convert into preference shares, those with both cumulative and non-cumulative coupon deferral provisions, and those with alternative coupon satisfaction mechanisms, are also included in the index. Securities in legal default are excluded from the Index.
ICE BofA Investment Grade Emerging Markets Corporate Plus China Issuers Index (ECNI) ICE BofA Investment Grade Emerging Markets Corporate Plus China Issuers Index is a subset of ICE BofA Emerging Markets Corporate Plus Index including all securities with China as the country of risk that are rated investment grade based on average of Moody's, S&P and Fitch. EMFN – EM Corporate Plus Financial is a subset of ICE BofA Emerging Markets Corporate Plus Index including all securities of financial issuers.
EMIE - The ICE BofA High Grade EMEA Emerging Markets Corporate Plus Index is a subset of ICE BofA Emerging Markets Corporate Plus Index including all securities rated BBB3 and higher with a country of risk within the Europe, Middle East and Africa regions.
EM4B – ICE BofA B & Lower Emerging Markets Corporate Plus Index is a subset of the ICE BofA Emerging Markets Corporate Plus Index.
EMRT – ICE BofA Emerging Markets Corporate Plus Transportation Index is a subset of ICE BofA Emerging Markets Corporate Plus Index including all securities of Transportation issuers other than airlines or railroads.
GSFCI - The Goldman Sachs Financial Conditions Index is a measure that assesses the overall financial conditions in the economy, taking into account various factors such as interest rates, credit spreads, and equity prices.
You cannot invest directly in an index, which also does not take into account trading commissions or costs. Additionally, indices do not include reinvestment of dividends, and the volatility of indices may be materially different over time.
------
Important information
Muzinich and/or Muzinich & Co. referenced herein is defined as Muzinich & Co., Inc. and its affiliates. Muzinich views and opinions. This material has been produced for information purposes only and as such the views contained herein are not to be taken as investment advice. Opinions are as of date of publication and are subject to change without reference or notification to you. Past performance is not a reliable indicator of current or future results and should not be the sole factor of consideration when selecting a product or strategy. The value of investments and the income from them may fall as well as rise and is not guaranteed and investors may not get back the full amount invested. Rates of exchange may cause the value of investments to rise or fall.
Any research in this document has been obtained and may have been acted on by Muzinich for its own purpose. The results of such research are being made available for information purposes and no assurances are made as to their accuracy. Opinions and statements of financial market trends that are based on market conditions constitute our judgment and this judgment may prove to be wrong. The views and opinions expressed should not be construed as an offer to buy or sell or invitation to engage in any investment activity, they are for information purposes only.
This discussion material contains forward-looking statements, which give current expectations of future activities and future performance. Any or all forward-looking statements in this material may turn out to be incorrect. They can be affected by inaccurate assumptions or by known or unknown risks and uncertainties. Although the assumptions underlying the forward-looking statements contained herein are believed to be reasonable, any of the assumptions could be inaccurate and, therefore, there can be no assurances that the forward-looking statements included in this discussion material will prove to be accurate. In light of the significant uncertainties inherent in the forward-looking statements included herein, the inclusion of such information should not be regarded as a representation that the objectives and plans discussed herein will be achieved. Further, no person undertakes any obligation to revise such forward-looking statements to reflect events or circumstances after the date hereof or to reflect the occurrence of unanticipated events.
In the United Arab Emirates (UAE) (excluding the Dubai International Financial Centre (DIFC) and the Abu Dhabi Global Market (ADGM): This document, and the information contained herein, does not constitute, and is not intended to constitute, a public offer of securities in the United Arab Emirates (“UAE”) and accordingly should not be construed as such. The Units are only being offered to a limited number of exempt Professional Investors in the UAE who fall under one of the following categories: federal or local governments, government institutions and agencies, or companies wholly owned by any of them. The Units have not been approved by or licensed or registered with the UAE Central Bank, the SCA, the Dubai Financial Services Authority, the Financial Services Regulatory Authority or any other relevant licensing authorities or governmental agencies in the UAE (the “Authorities”). The Authorities assume no liability for any investment that the named addressee makes as a Professional Investor. The document is for the use of the named addressee only and should not be given or shown to any other person (other than employees, agents or consultants in connection with the addressee’s consideration thereof).
In the United Arab Emirates (UAE) (including the Dubai International Financial Centre and the Abu Dhabi Global Market): This information does not constitute or form part of any offer to issue or sell, or any solicitation of any offer to subscribe for or purchase, any securities or investment products in the UAE and accordingly should not be construed as such. Furthermore, this information is being made available on the basis that the recipient is an entity fully regulated by the ADGM Financial Services Regulatory Authority (FSRA), and acknowledges and understands that the entities and securities to which it may relate have not been approved, licensed by or registered with the UAE Central Bank, the Dubai Financial Services Authority, the UAE Securities and Commodities Authority, the Financial Services Regulatory Authority or any other relevant licensing authority or governmental agency in the UAE. The content of this report has not been approved by or filed with the UAE Central Bank, the Dubai Financial Services Authority, the UAE Securities and Commodities Authority or the Financial Services Regulatory Authority.
United States: This material is for Institutional Investor use only – not for retail distribution. Muzinich & Co., Inc. is a registered investment adviser with the Securities and Exchange Commission (SEC). Muzinich & Co., Inc.’s being a Registered Investment Adviser with the SEC in no way shall imply a certain level of skill or training or any authorization or approval by the SEC.
Issued in the European Union by Muzinich & Co. (Ireland) Limited, which is authorized and regulated by the Central Bank of Ireland. Registered in Ireland, Company Registration No. 307511. Registered address: 32 Molesworth Street, Dublin 2, D02 Y512, Ireland. Issued in Switzerland by Muzinich & Co. (Switzerland) AG. Registered in Switzerland No. CHE-389.422.108. Registered address: Tödistrasse 5, 8002 Zurich, Switzerland. Issued in Singapore and Hong Kong by Muzinich & Co. (Singapore) Pte. Limited, which is licensed and regulated by the Monetary Authority of Singapore. Registered in Singapore No. 201624477K. Registered address: 6 Battery Road, #26-05, Singapore, 049909. Issued in all other jurisdictions (excluding the U.S.) by Muzinich & Co. Limited. which is authorized and regulated by the Financial Conduct Authority. Registered in England and Wales No. 3852444. Registered address: 8 Hanover Street, London W1S 1YQ, United Kingdom. 2026-04-15-18279

By clicking "Submit", I am (i) signing up to receive the Opinion Pieces from the "Opinions" page of the Muzinich & Co website, (ii) representing that the above information is true and accurate and (iii) agreeing to join the Muzinich & Co mailing list. I understand that Muzinich & Co will not add retail investors or individuals with personal email addresses to its mailing list and represent that I am not a retail investor. By providing my personal and professional information I am consenting to its use and disclosure in accordance with the Muzinich & Co. Privacy Policy. I understand that I may withdraw my consent and unsubscribe from receiving future communications by clicking "Unsubscribe" from the emails that are sent to me from Muzinich & Co.