Emerging market hard currency: two sides of the same coin
EM Monthly
November 19, 2026
If you have any feedback on this article or are interested in subscribing to our content, please contact us at opinions@muzinich.com or fill out the form on the right hand side of this page.
--------
Why would a country or company issue debt in a foreign currency? It exposes the issuer to foreign-exchange risk; if the local currency falls, the debt servicing cost and debt stock balloon. This currency mismatch played a central role in the 1980’s Latin American debt crisis, Asian financial crisis and Argentina’s repeated defaults. Even under normal conditions the issuer is tied to a foreign central bank whose policy may be out of sync with the domestic economic cycle. Cynically speaking, sovereigns borrowing in foreign currencies lose the option of printing money to repay their debts or inflating it away.
So why take the risk? The hard currency market was born of necessity. The Brady Plan of 1989 converted defaulted 1980s defaulted bank loans into tradable US-dollar bonds, creating the emerging market (EM) sovereign bond market. The ICE BofA’s EM sovereign index was born soon after, in December 1991.
Beyond that, the original justification was credibility and discipline. By borrowing in a foreign currency (i.e. US dollars), governments with poor records could borrow US policy credibility. For investors, the attraction was the removal of local-currency risk, allowing a focus on credit risk. It also created a new asset class, bringing diversification benefits to bond portfolios.
The corporate universe arrived in December 1998, arguably delayed until a sovereign curve had been established to serve as a pricing benchmark. Indeed, sovereigns have cited establishing a benchmark a rationale for debt issuance, albeit a weak one. As with sovereigns, corporates were attracted by access to larger pools of longer-term capital, particularly in capital-intensive sectors. It also reduced their dependence on often small, concentrated or impaired domestic banking systems.
Investors welcomed exposure to strong companies, often national champions or global leaders, without assuming the full sovereign risk. For corporates, foreign-currency borrowing also allowed liabilities to be matched with revenues, particularly in dollar-denominated commodity sectors and business with international operations or acquisitions.
Sovereigns versus corporates: Where does the value lie?
For issuers and investors, the case for EM hard currency is clear: allocation benefits significantly outweigh shortcomings. So where should an investor allocate - sovereigns or corporates?
On the surface there is little between them. Both are around US$1.5tn in size with similar yields of 6%.1
Figure 1 – EM corporate and sovereign hard currency universes by rating
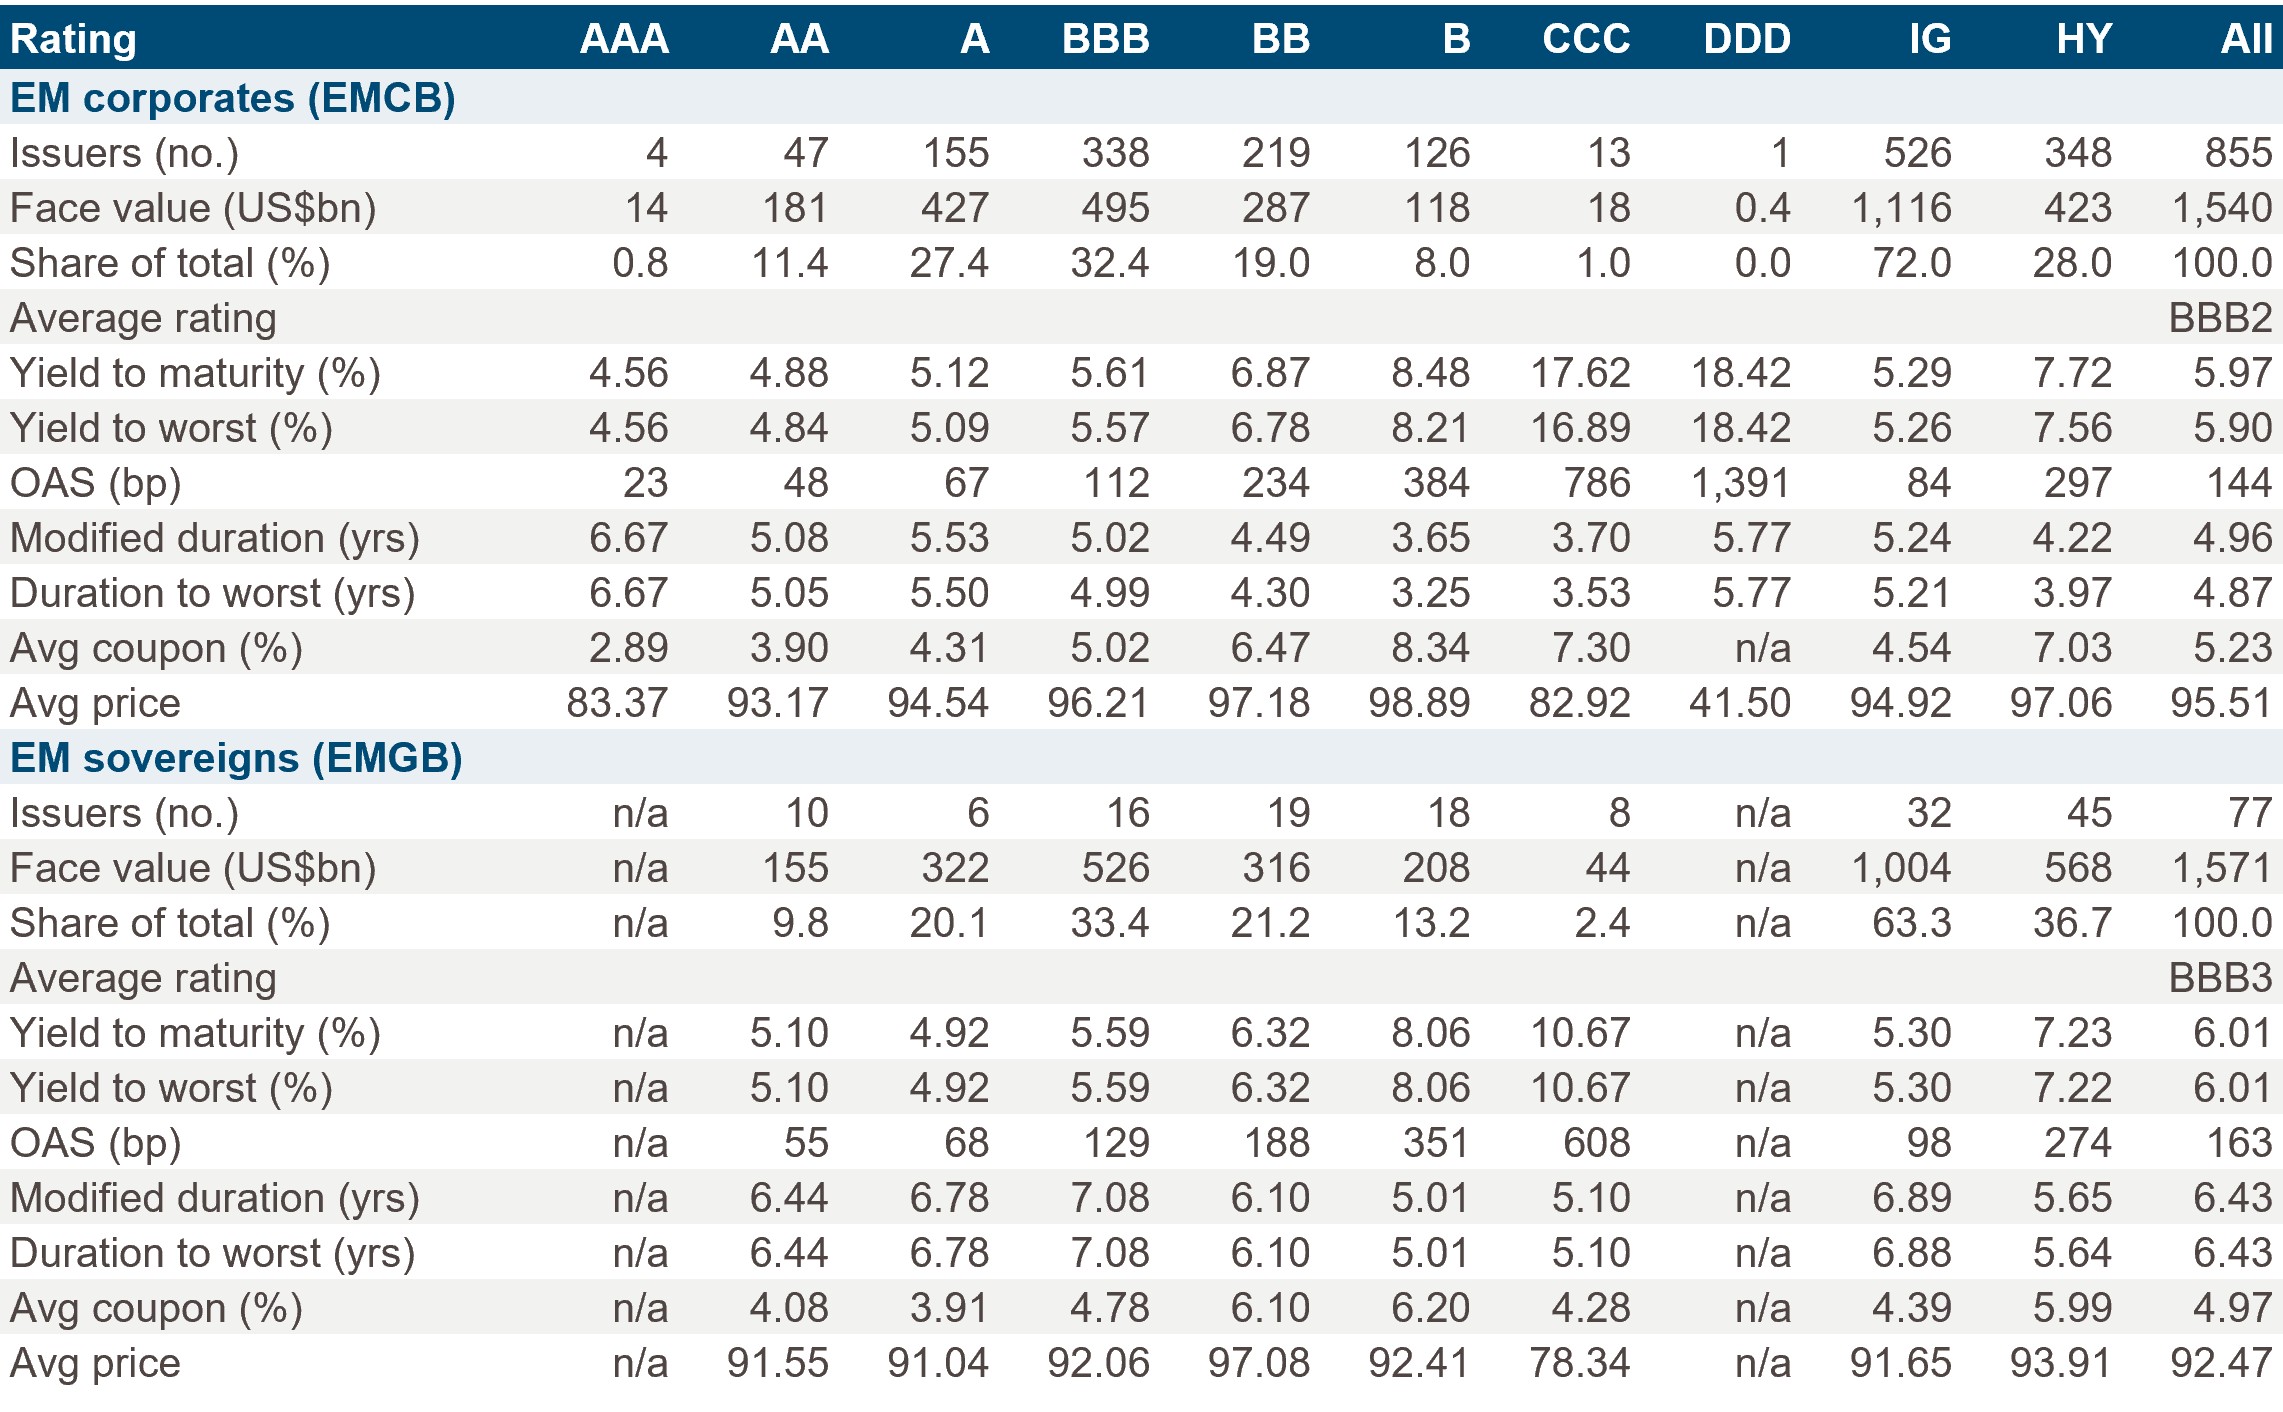
Source: ICE data platform, as of 2nd November. EMCB = ICE BofA Emerging Markets Corporate Plus Index; EMGB = ICE BofA Emerging Markets External Sovereign Index. OAS = option-adjusted spread. Averages are par-weighted. For illustrative purposes only.
However, a deeper dive reveals important differences.
1. Duration
Investors should expect more volatility across interest-rate cycles. For every 100bps move in yields, the EM index’s (EMGB) price return should differ from the EM corporate index’s (EMCB) by c.1.5%.
This reflects their different needs. Sovereigns benefit from longer-term borrowing that reduce refinancing risk, while corporates typically match debt maturities to the lives of the assets being financed.
2. Credit quality
While compensation is almost identical, credit risk is not. EMGB’s average rating is BBB3, one notch lower than EMCB’s.
Sovereigns with underdeveloped domestic capital markets or weaker creditworthiness are more likely to borrow in hard currency, contributing to a greater representation of lower rated issues. By contrast, international corporate debt markets favour larger, higher-quality issuers with the resources and infrastructure to meet international standards, skewing the universe towards higher ratings.
Corporate investors may argue that higher yields partly compensate for embedded call options, which allow issuers to redeem debt early, potentially limiting investors’ upside. Sovereign investors meanwhile may be more willing to accept lower credit ratings, given governments’ ability to raise revenues, access international finance support and, where the capacity and willingness to pay exist, continue servicing their debt obligations (i.e. default is unlikely).
The credit quality divide is clear. EMGB comprises 30% of top quality (A3 or higher), 10% less than EMCB. The gap reverses at the riskier end. B1 rated and lower bonds account for 16% of the EMGB, almost twice EMCB’s exposure. Even if sovereign defaults are rarer, this weaker credit profile, combined with longer duration, leaves investors more exposure to volatility as credit risk rises.
The quality bias also shapes regional exposure. Asian credit has strengthened considerably since the Asian financial crisis, with Asian corporates now the highest-rated region in the corporate index. By contrast, Asia has a much smaller weighting in the sovereign index, as most governments fund themselves through deep local-currency markets (Figure 2).
Latin America is the only high-yield region in the corporate index and is the smallest regional weighting. The sovereign index, meanwhile, is heavily skewed towards EMEA, reflecting substantial Middle Eastern issuance to fund deficits following weaker oil revenues, alongside growing high-yield issuance from African sovereigns with less developed domestic capital markets.
For investors seeking exposure to Asia’s rising middle class, world-leading manufacturers benefiting from the global AI build-out and its role as a global growth engine, corporate bonds offer a more efficient route. Sovereign investors, meanwhile, should recognise the index’s significant EMEA concentration and associated geopolitical risks, as illustrated by the Russia–Ukraine war and conflicts involving Iran.
Figure 2 – Regional split: Corporates vs. sovereigns
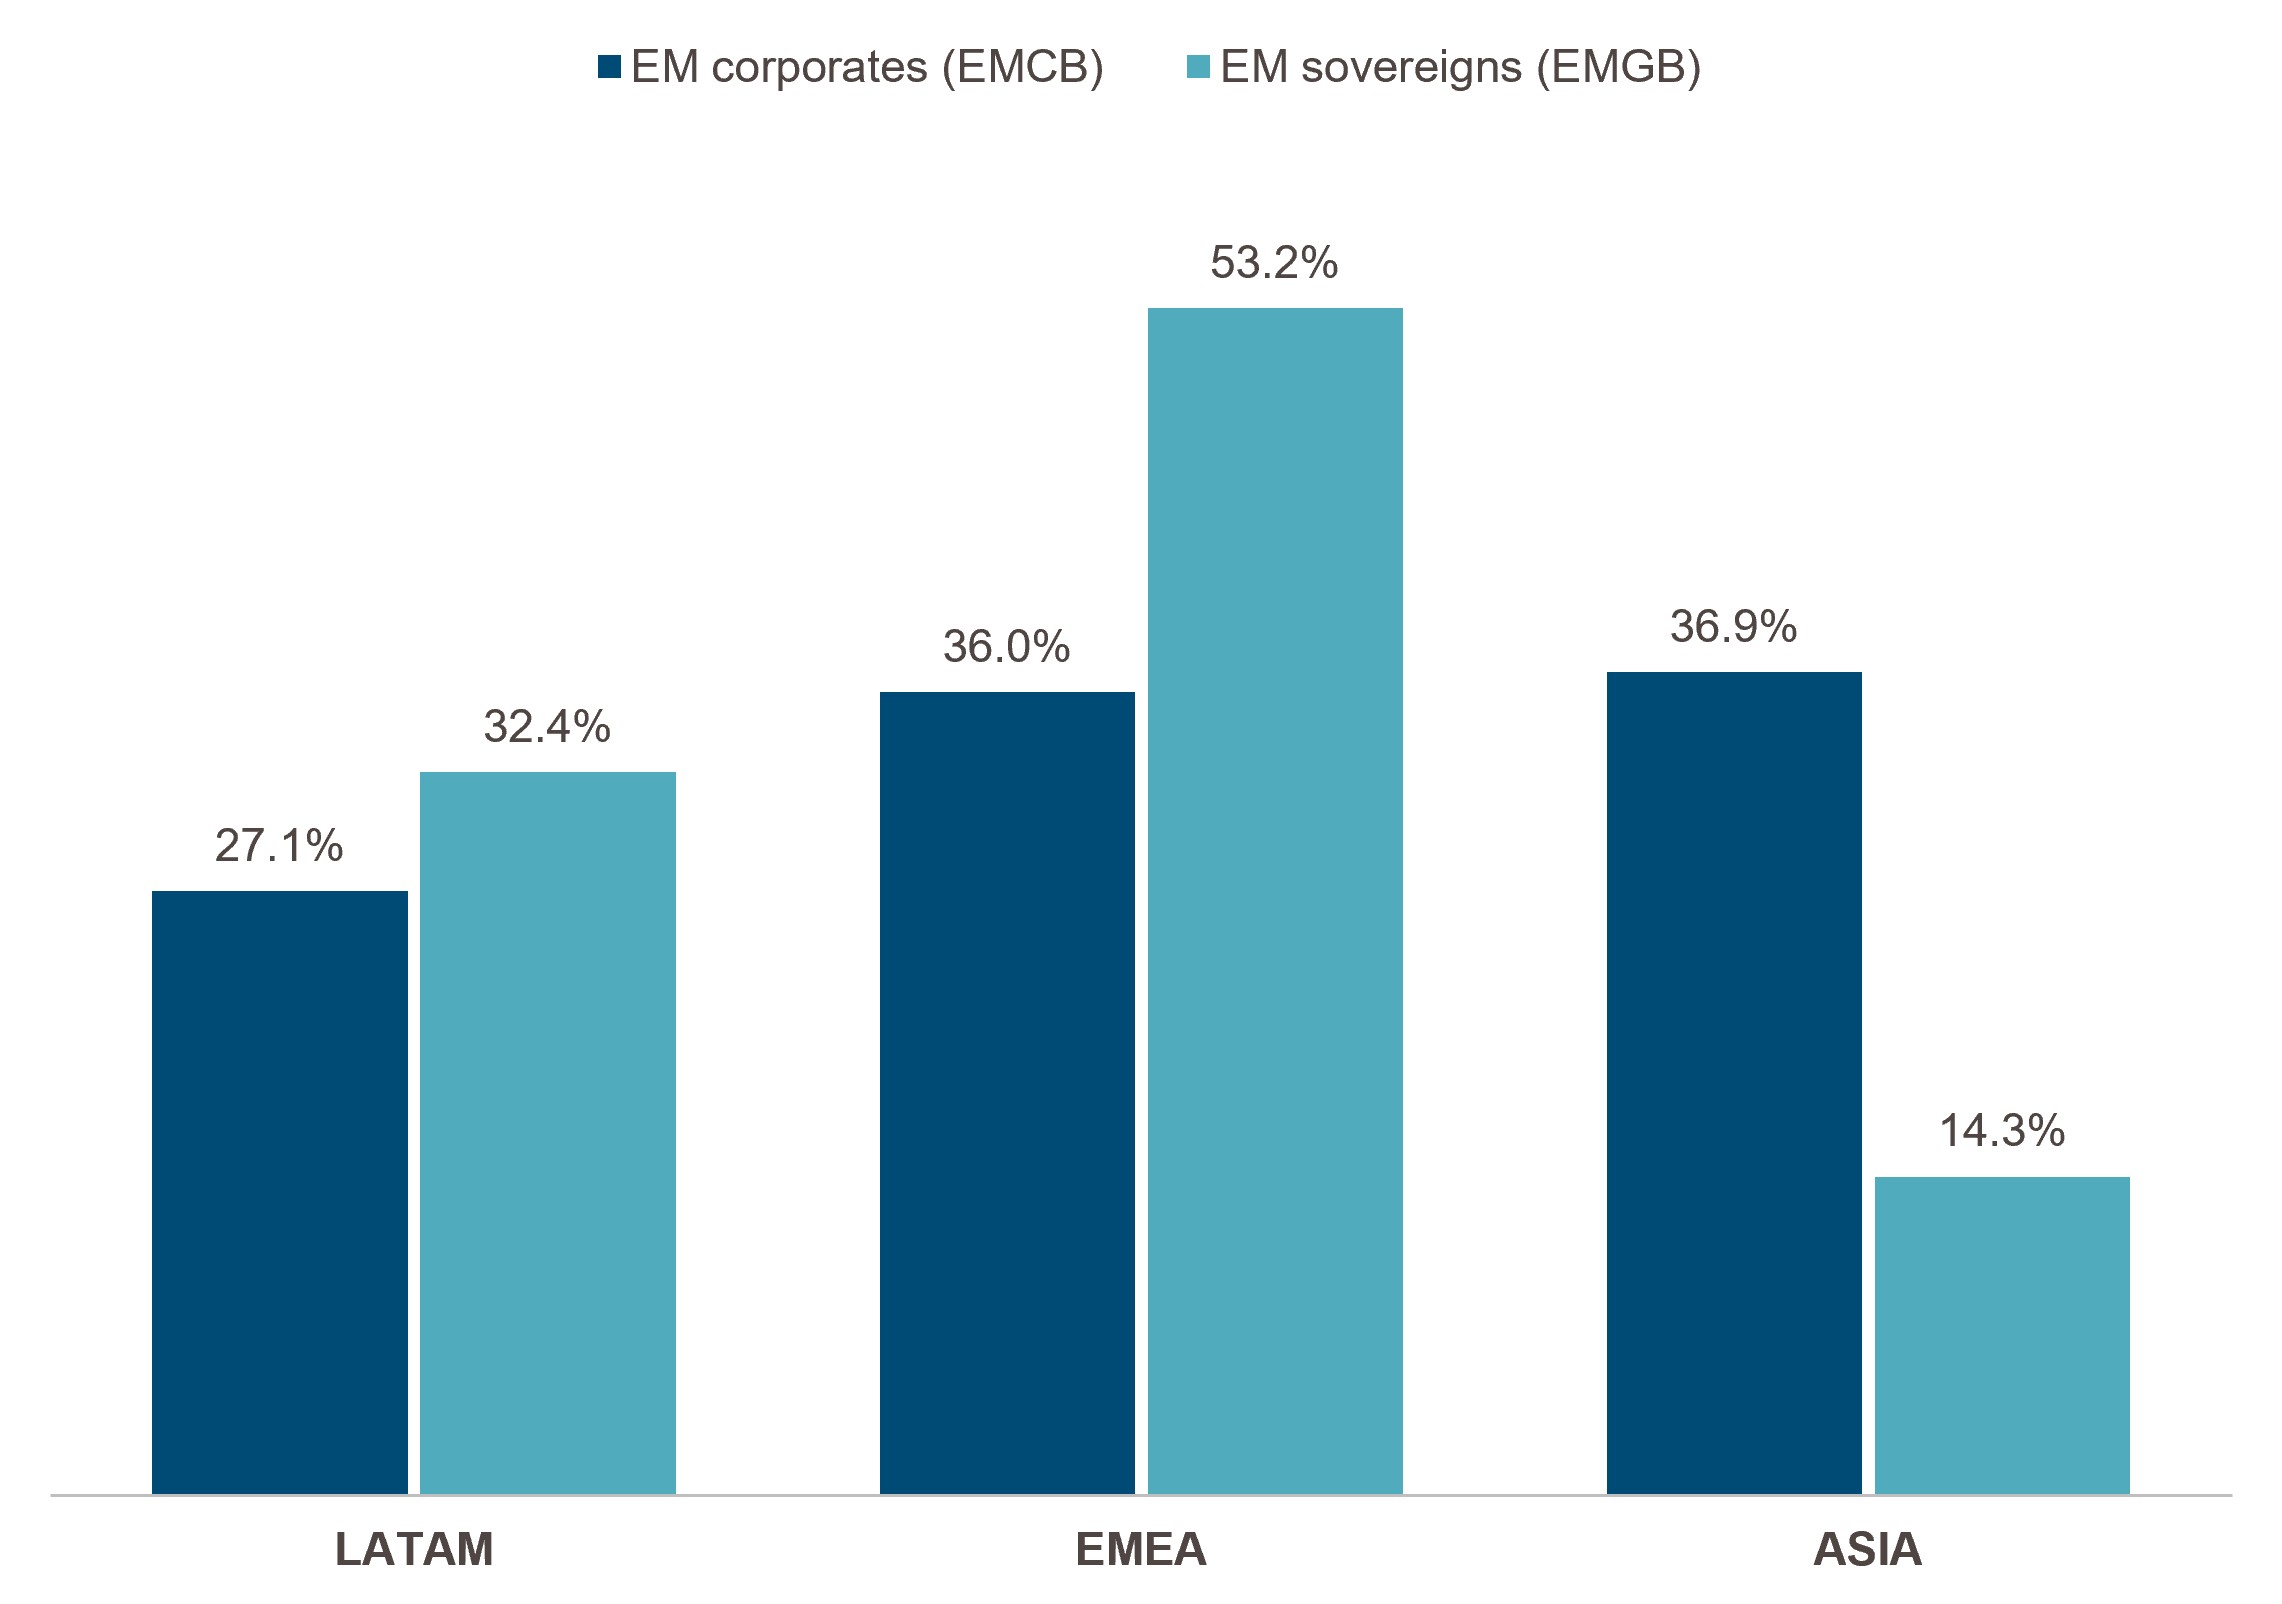
Share of index market value by region. Source: ICE data platform, as of 2nd November 2026. EMCB = ICE BofA Emerging Markets Corporate Plus Index; EMGB = ICE BofA Emerging Markets External Sovereign Index. For illustrative purposes only.
3. Diversification
The final difference is in issuer numbers. The sovereign universe offers 77 entities versus 855 in the corporate index. While there is no industry standard for a minimum number of issuers to build a well-diversified credit portfolio, debt returns are skewed. The upside is capped by coupons and repayment at par, while the downside from a default can be significant. Bond portfolios therefore need more names than equity ones to diversify away issuer-specific risk and the lower the rating, the more names are needed. A common rule of thumb is 60+ issuers for a BBB portfolio which puts a sovereign portfolio manager in a dilemma. With an index averaging BBB3 and a meaningful single-B tail, 60 issuers is a floor rather than a target. With only 77 to choose from, the manager is virtually a forced buyer of the whole universe just to mitigate downgrade and default risks.
Corporate managers face no such constraint and can exploit granular investment themes beyond the scope of sovereign credit. These include the growth of telecommunications and technology, green energy, the cyclicality of chemicals and protein and weather events such as El Niño.
Similar markets, different outcomes: The corporate advantage
As the proof of the pudding is in the eating, we compare the corporate and sovereign universes’ return profiles over the last five years which included war, sector bubbles, full interest rate and commodity cycles, elections and sanctions.
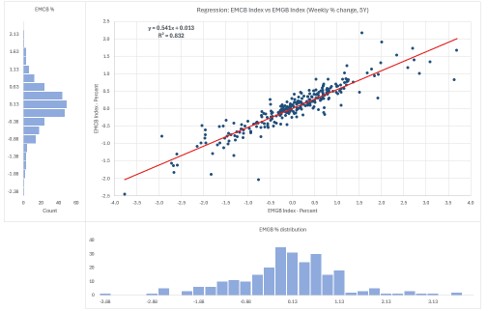
As expected the relationship is tight. An R² of 0.832 means roughly 83% of the corporate universe’s weekly variance is explained by the sovereign universe, leaving 17% that is corporate-specific. A beta of 0.54 captures the more defensive profile of corporates in-line with the characteristic differentiation drawn out above.
Over the period analysed, EMCB returned 6.0% in total against 4.2% for the sovereign index and did so with annualised volatility of 4.7% against 7.9%, around 40% lower. This difference in volatility is best observed through the histogram of weekly total returns, with corporate returns staying within c. ±2.5% while sovereign returns stretch to nearly ±4%. While regression intercept is small at 0.013% a week, annualised it equates to c. 0.7% of alpha generation for the corporate universe. This suggests that corporate bonds can play a valuable role in strengthening the risk-return profile of an emerging market hard currency debt portfolio.
Figure 3 – EMCB vs EMGB weekly returns: regression and distribution
Past performance is not a reliable indicator of current or future results.
Source: ICE data platform, Muzinich. Weekly total returns, 7 November 2021 to 1 November 2026. EMCB = ICE BofA Emerging Markets Corporate Plus Index; EMGB = ICE BofA Emerging Markets External Sovereign Index.
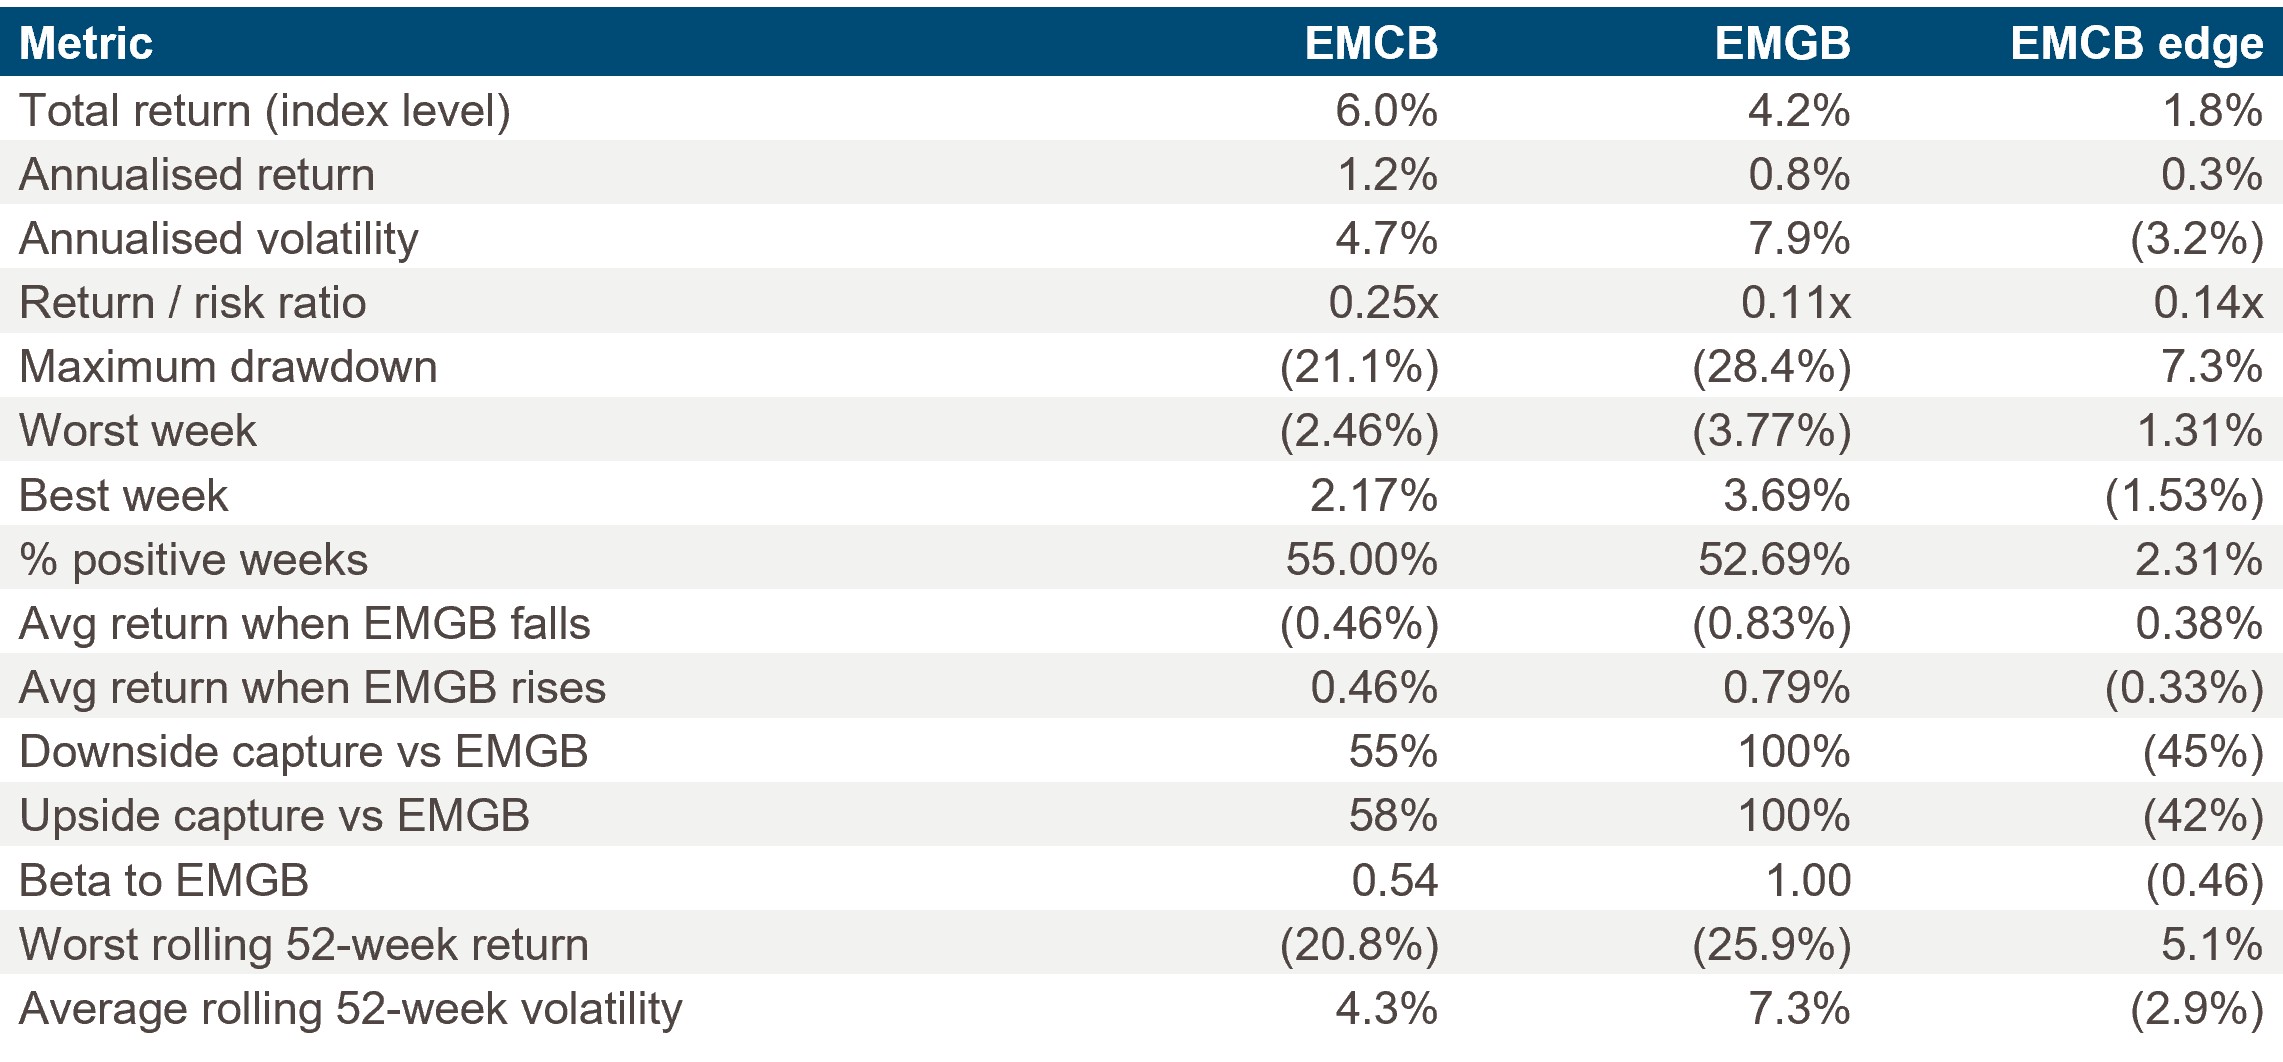
Digging deeper the main differentiator is the path taken during drawdown. Corporates saw a max. drawdown of -21.1% vs. -28.4% for sovereigns, and a worst single week of -2.46% against -3.77%. Returns were also more consistent for corporates, with 55.0% of positive weeks vs. 52.7% for sovereigns. Together this gives corporates a better return per unit of risk: 0.25x vs. 0.11x, or roughly twice as efficient (Figure 4).
Figure 4 – Return and risk statistics: EMCB vs EMGB
Past performance is not a reliable indicator of current or future results.
Source: ICE data platform, Muzinich. Weekly data, 7 November 2021 to 1 November 2026 (5.0 years). Figures in brackets are negative. EMCB = ICE BofA Emerging Markets Corporate Plus Index; EMGB = ICE BofA Emerging Markets External Sovereign Index.
Regarding hedging, duration can be managed using Treasury futures markets for the sovereign and the corporate indexes. In terms of credit risk, however, sovereigns have a clear advantage. Both index and single-name CDS markets are more established and deeper than for emerging market corporates, giving sovereign investors a more practical route to hedging credit risk and trimming drawdowns.
Why EM corporates deserve an allocation
Joining the dots, an allocation to EM hard currency debt is advantageous to investors. It improves the overall efficiency of the portfolio while giving access to two distinct return drivers. On the sovereign side, it offers exposure to countries on an improving ratings trajectory, with different underlying economic profiles than mature developed markets. Corporate credit offers exposure to leading global producers of raw materials and manufactured goods, alongside opportunities arising from growing consumer wealth and an expanding middle class.
For an investor, the choice depends on their objective. Those seeking lower volatility or a better risk/reward ratio may prefer corporates. Investors seeking an asset-class rally, and willing to tolerate greater volatility, may favour credit for its higher beta and greater sensitivity to falling yields.
A third approach is to combine the two, capturing the strengths of each. With its longer duration and deeper market for long-dated bonds, sovereign credit offers a more efficient way to express an interest rate view. Corporates are a more efficient source of spread.
Accessing it via a short duration structure offers the opportunity to capture the carry and the pull-to-par nature of the corporate asset class, while the rates decision can be taken elsewhere. An alternative could be to pair a sovereign allocation with a dedicated Asian credit strategy which could fill the most obvious gap in the sovereign index, which as he have already highlighted, only has a 14% Asian allocation.
EM look back – October
Past performance is not a reliable indicator of current or future results.
All sources are Bloomberg unless otherwise stated.
This material is not intended to be relied upon as a forecast, research, or investment advice, and is not a recommendation, offer or solicitation to buy or sell any securities or to adopt any investment strategy. The opinions expressed by Muzinich & Co. are as of November 2026 and may change without notice.
Market Data
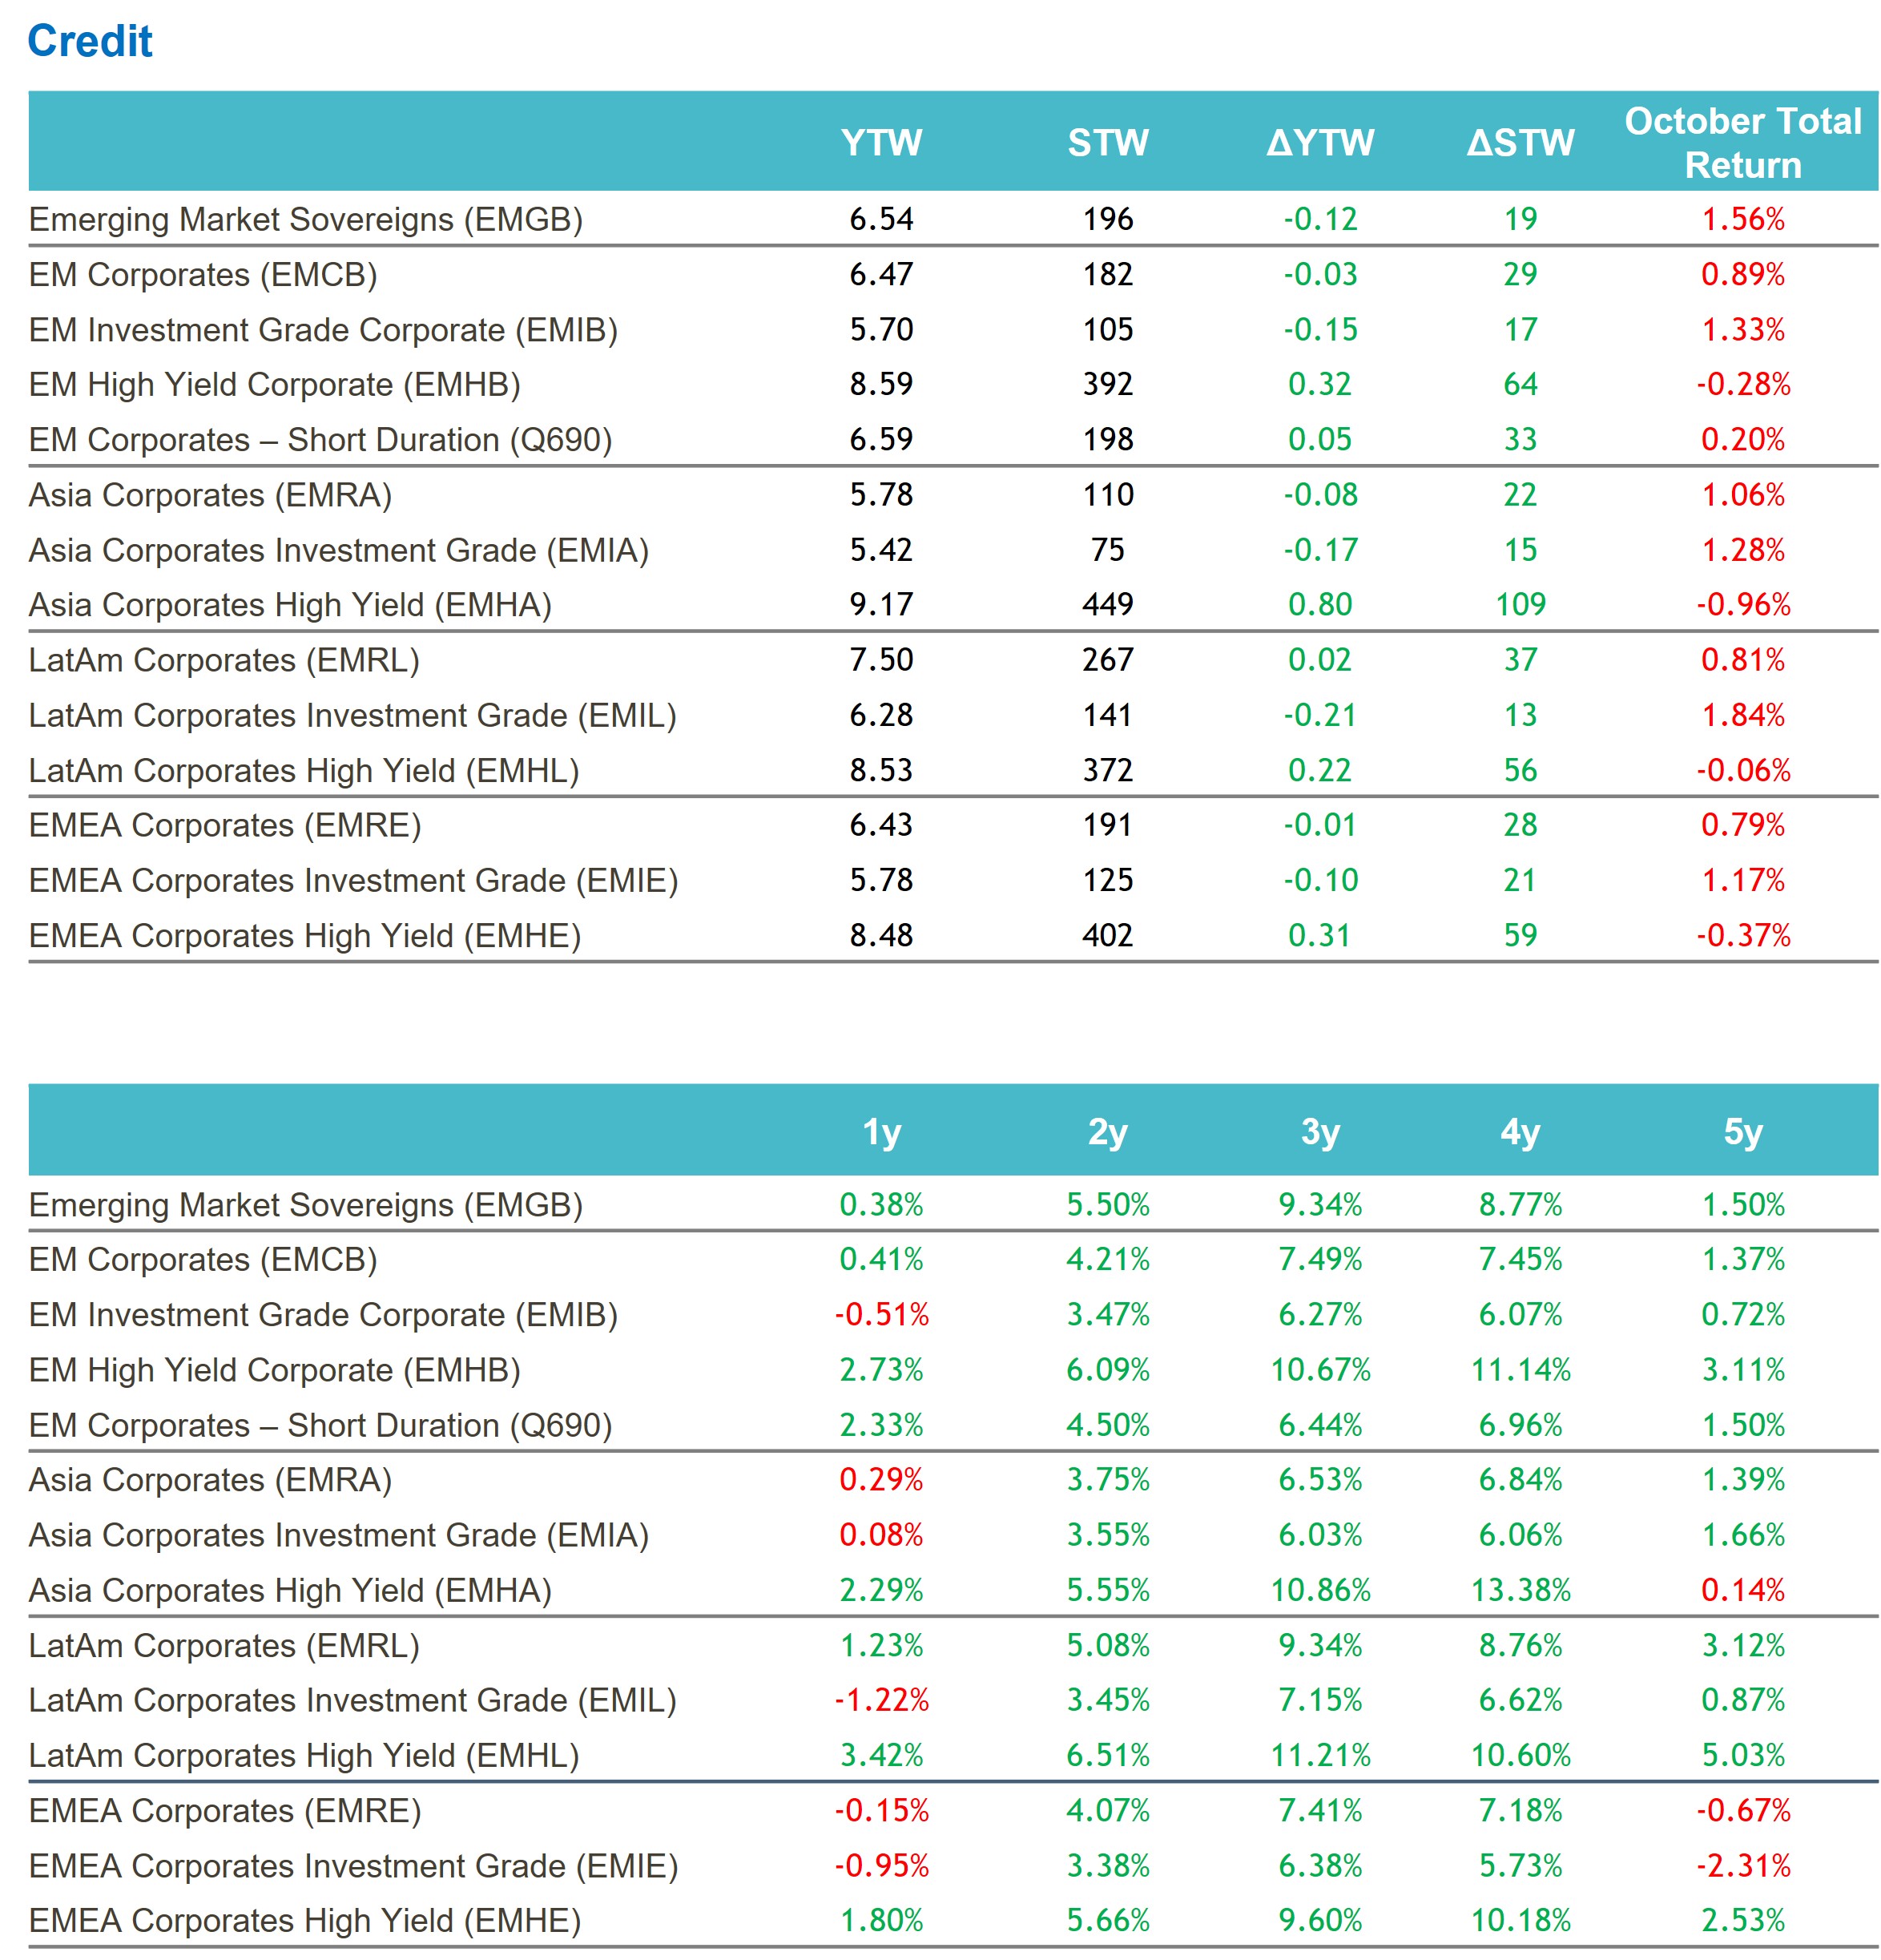
Past performance is not a reliable indicator of current or future results.
Source: ICE data platform. as of 31st October 2026. EMGB - ICE BofA Emerging Markets External Sovereign Index EMCB - ICE BofA Emerging Markets Corporate Plus Index, EMIB - ICE BofA High Grade Emerging Markets Corporate Plus Index, EMHB - ICE BofA High Yield Emerging Markets Corporate Plus Index, Q690 - ICE BofA Custom Emerging Markets Short Duration Index, EMRA - ICE BofA Asia Emerging Markets Corporate Plus Index, EMIA - ICE BofA High Grade Asia Emerging Markets Corporate Plus Index, EMHA - ICE BofA High Yield Asia Emerging Markets Corporate Plus Index , EMRL - ICE BofA Latin America Emerging Markets Corporate Plus Index, EMIL - The ICE BofA High Grade Latin America Emerging Markets Corporate Index, EMHL - ICE BofA High Yield Latin America Emerging Markets Corporate Plus, EMRE - ICE BofA EMEA Emerging Markets Corporate Plus Index, EMIE - ICE BofA High Grade EMEA Emerging Markets Corporate Plus Index, EMHE - ICE BofA High Yield EMEA Emerging Markets Corporate Plus Index,. Index performance is for illustrative purposes only. You cannot invest directly in the index. Indices selected provide best proxy for highlighting performance of emerging market corporate bonds. For illustrative purposes only.
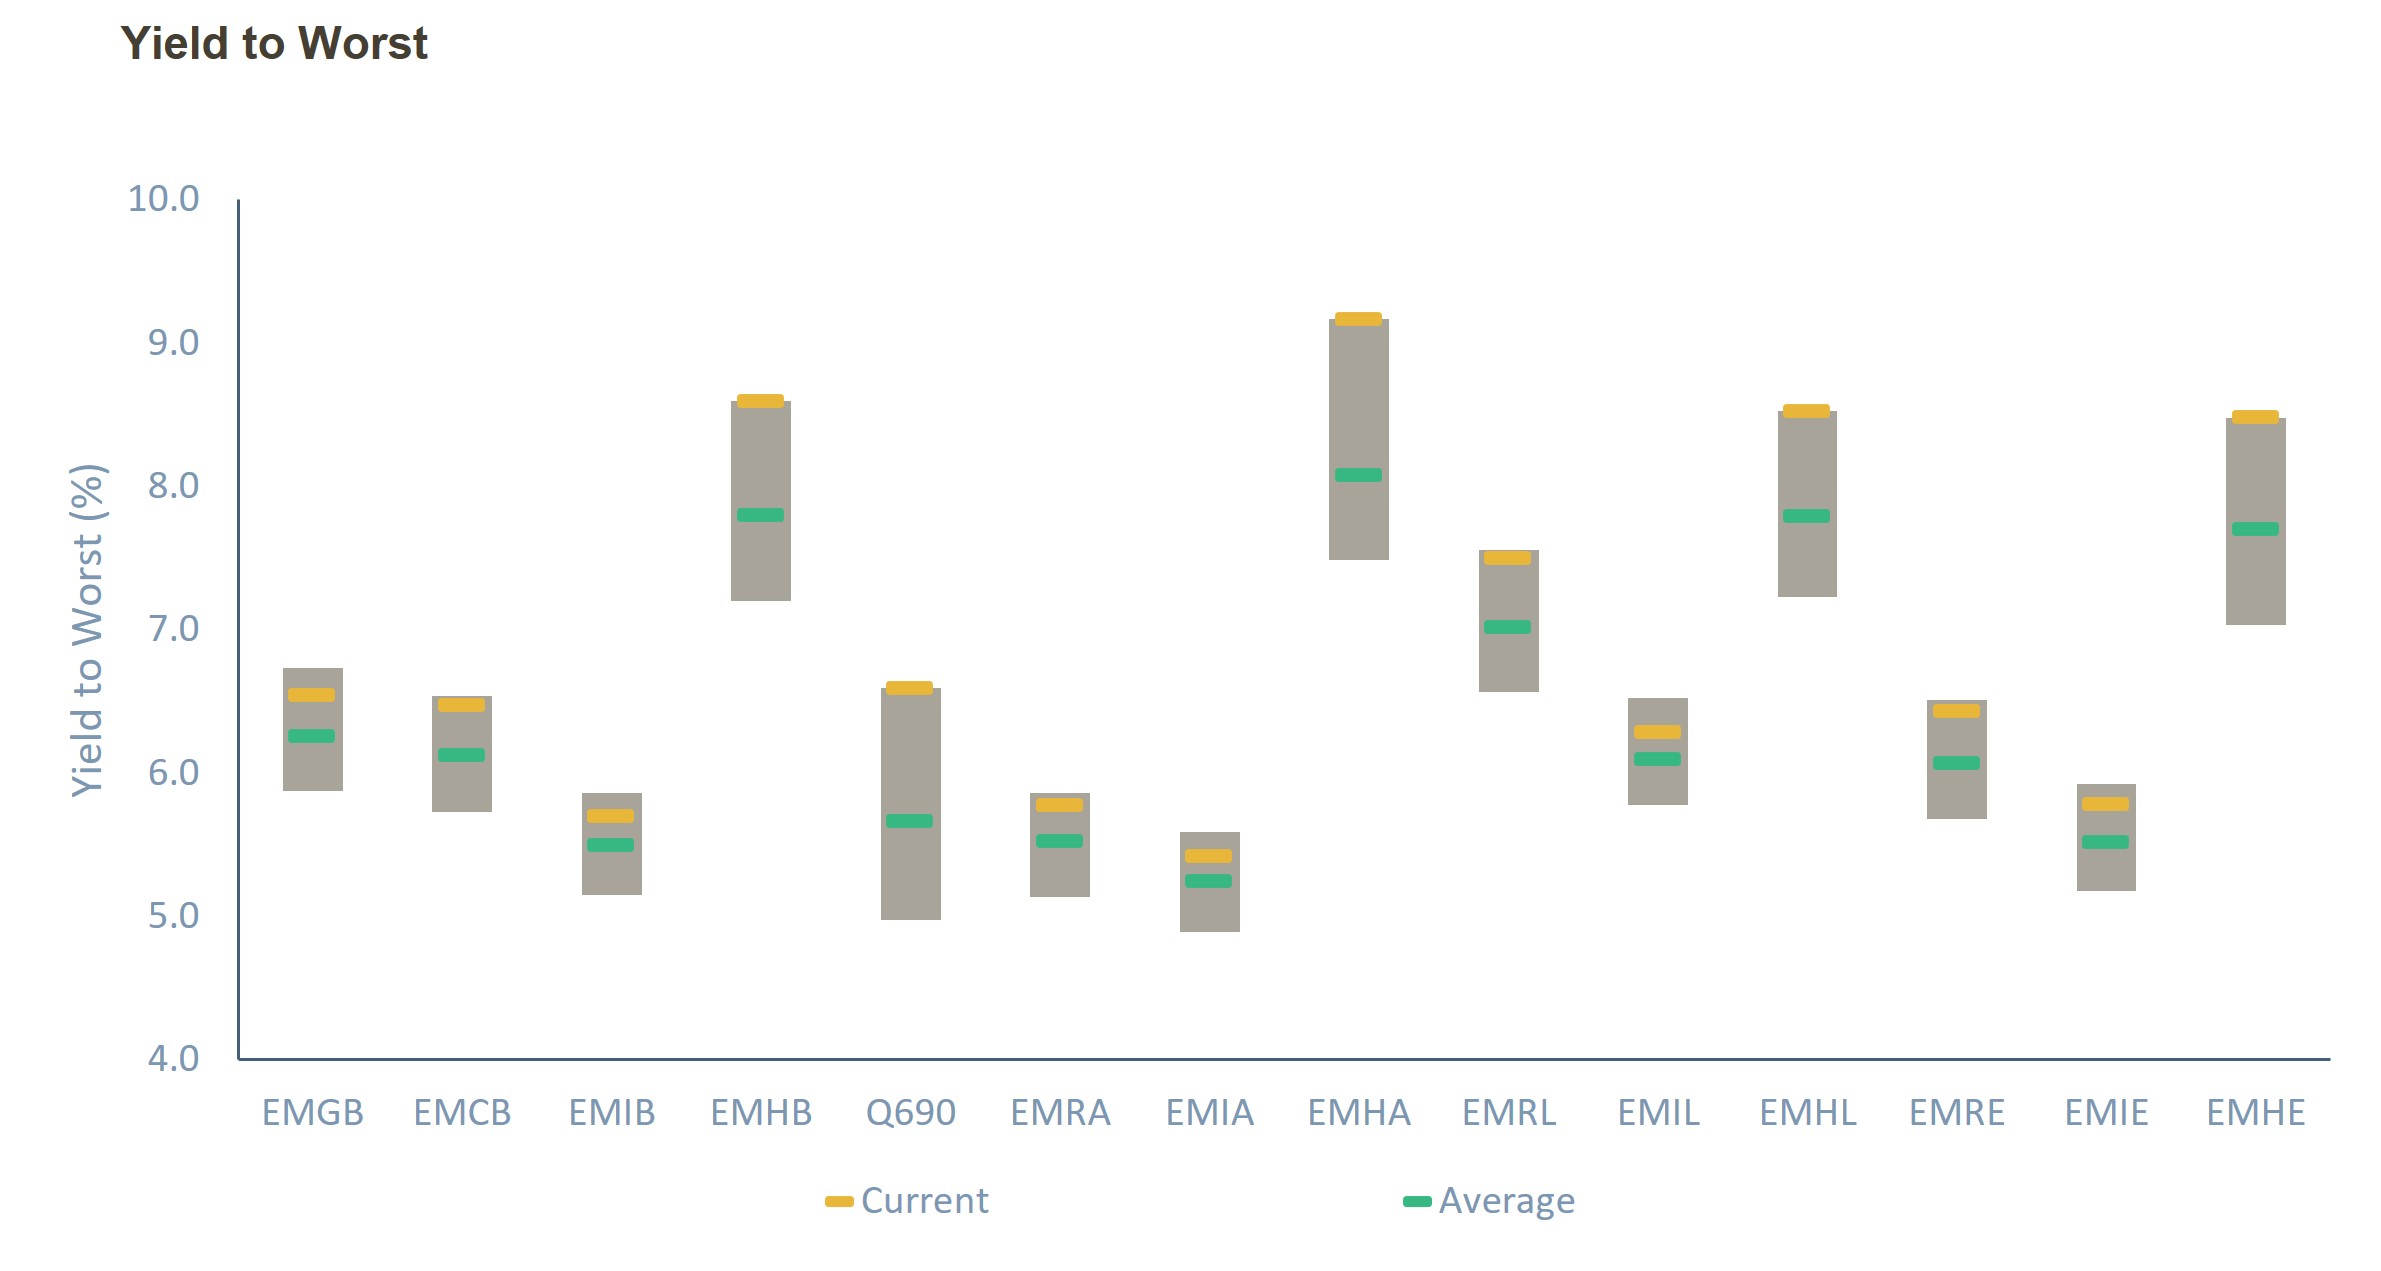 Source: ICE data platform. as of 31st October 2026. EMGB - ICE BofA Emerging Markets External Sovereign Index EMCB - ICE BofA Emerging Markets Corporate Plus Index, EMIB - ICE BofA High Grade Emerging Markets Corporate Plus Index, EMHB - ICE BofA High Yield Emerging Markets Corporate Plus Index, Q690 - ICE BofA Custom Emerging Markets Short Duration Index, EMRA - ICE BofA Asia Emerging Markets Corporate Plus Index, EMIA - ICE BofA High Grade Asia Emerging Markets Corporate Plus Index, EMHA - ICE BofA High Yield Asia Emerging Markets Corporate Plus Index , EMRL - ICE BofA Latin America Emerging Markets Corporate Plus Index, EMIL - The ICE BofA High Grade Latin America Emerging Markets Corporate Index, EMHL - ICE BofA High Yield Latin America Emerging Markets Corporate Plus, EMRE - ICE BofA EMEA Emerging Markets Corporate Plus Index, EMIE - ICE BofA High Grade EMEA Emerging Markets Corporate Plus Index, EMHE - ICE BofA High Yield EMEA Emerging Markets Corporate Plus Index,. Index performance is for illustrative purposes only. You cannot invest directly in the index. Indices selected provide best proxy for highlighting performance of emerging market corporate bonds. For illustrative purposes only.
--------
Index descriptions
EMGB - ICE BofA Emerging Markets External Sovereign Index tracks the performance of US dollar and euro denominated emerging markets sovereign debt publicly issued in the major domestic and eurobond markets. Qualifying securities must have risk exposure to countries other than members of the FX-G10, all Western European countries and territories of the US and Western European countries.
EMCB - ICE BofA Emerging Markets Corporate Plus Index tracks the performance of the US dollar and euro denominated emerging markets non-sovereign debt publicly issued in the major domestic and eurobond markets. Qualifying issuers must have risk exposure to countries other than members of the FX G10, all Western European countries, and territories of the US and Western European countries.
EMIB - ICE BofA High Grade Emerging Markets Corporate Plus Index is a subset of the ICE BofA ML Emerging Markets Corporate Plus Index (EMCB) including all securities rated AAA through BBB3, inclusive.
EMHB - ICE BofA High Yield Emerging Markets Corporate Plus Index is a subset of the ICE BofA ML Emerging Markets Corporate Plus Index (EMCB) including all securities rated BB1 or lower.
Q690 - ICE BofA Custom Emerging Markets Short Duration Index tracks the performance of short-term US dollar and euro denominated emerging markets non-sovereign debt publicly issued in the major domestic and eurobond markets.
EMRA - ICE BofA Asia Emerging Markets Corporate Plus Index is the subset of the ICE BofAML Emerging Markets Corporate Plus Index, which includes only securities issued by countries associated with the region of Asia, excluding Kazakhstan, Kyrgyzstan, Tajikistan, Turkmenistan, and Uzbekistan.
EMHA – The ICE BofA High Yield Asia Emerging Markets Corporate Plus Index is a subset of ICE BofA Emerging Markets Corporate Plus Index including all securities rated BB1 and lower with a country of risk within the Asia region.
EMIA - The ICE BofA High Grade Asia Emerging Markets Corporate Plus Index is a subset of ICE BofA Emerging Markets Corporate Plus Index including all securities rated BBB3 and higher with a country of risk within the Asia region.
EMRL - ICE BofA Latin America Emerging Markets Corporate Plus Index is a subset of The ICE BofA Emerging Markets Corporate Plus Index including all securities issued by countries associated with the geographical region of Latin America.
EMIL - The ICE BofA High Grade Latin America Emerging Markets Corporate Index is a subset of ICE BofA Emerging Markets Corporate Plus Index including all securities rated BBB3 and higher with a country of risk within the Latin America region.
EMHL - ICE BofA High Yield Latin America Emerging Markets Corporate Plus is a subset of ICE BofA Emerging Markets Corporate Plus Index including all securities rated sub-investment grade based on the average of Moody's, S&P and Fitch, and with a country of risk associated with the geographical region of Latin America.
EMRE - ICE BofA EMEA Emerging Markets Corporate Plus Index is a subset of The ICE BofA Emerging Markets Corporate Plus Index including all securities issued by countries associated with the geographical region of Europe, the Middle East and Africa including Kazakhstan, Kyrgyzstan, Tajikistan, Turkmenistan and Uzbekistan.
EMIE - ICE BofA High Grade EMEA Emerging Markets Corporate Plus Index is a subset of ICE BofA Emerging Markets Corporate Plus Index including all securities rated BBB3 and higher with a country of risk within the Europe, Middle East and Africa regions.
EMHE - ICE BofA High Yield EMEA Emerging Markets Corporate Plus Index is a subset of ICE BofA Emerging Markets Corporate Plus Index including all securities rated BBB3 and higher with a country of risk within the Europe, Middle East and Africa regions.
The MSCI EM Index is a free-float weighted equity index that captures large and mid cap representation across emerging market countries. The index covers approximately 85% of the free float-adjusted market capitalisation in each country.
LDMP - ICE BofA Local Debt Markets Plus Index is designed to track the performance of emerging markets sovereign debt publicly issued and denominated in the issuer's own currency.
J0A0 - The ICE BofA ML US Cash Pay High Yield Index tracks the performance of US dollar denominated below investment grade corporate debt, currently in a coupon paying period that is publicly issued in the US domestic market.
J0A1 – The ICE BofA BB US Cash Pay High Yield Index is a subset of the ICE BofA US Cash Pay High Yield Index (J0A0) including all securities rated BB1 through BB3, inclusive.
C0C0A0 - The ICE BofA ML US Corporate Index tracks the performance of US dollar denominated investment grade corporate debt publicly issued in the US domestic market.
HE00 - The ICE BofA ML Euro High Yield Index tracks the performance of EUR dominated below investment grade corporate debt publicly issued in the euro domestic or eurobond markets.
ER00 – The ICE BofA ML Euro Corporate Index tracks the performance of EUR denominated investment grade corporate debt publicly issued in the eurobond or Euro member domestic markets.
ICE BofA High Yield Emerging Markets Corporate Plus India Issuers Index (EINH) - is a subset of ICE BofA Emerging Markets Corporate Plus Index
ADHY - ICE BofA Asian Dollar High Yield Index tracks the performance of sub-investment grade U.S. dollar denominated sovereign, quasi-government, corporate, securitized and collateralized debt publicly issued in the U.S. domestic and eurobond markets by Asian issuers.
ICE BofA BB Asian Dollar High Yield Index (ACH1) ICE BofA BB Asian Dollar High Yield Index is a subset of ICE BofA Asian Dollar High Yield Corporate Index including all securities rated BB1 through BB3, inclusive.
ADIG - ICE BofA Asian Dollar Investment Grade Index tracks the performance of investment grade U.S. dollar denominated sovereign, quasi-government, corporate, securitized and collateralized debt publicly issued in the U.S. domestic and eurobond markets by Asian issuers. Qualifying securities have a country of risk classified as an Emerging Markets country that is part of the Asia/Pacific Region.
CEMBI Broad Div. Index - The JP Morgan CEMBI Broad Diversified Index (CEMBIB Div) is a benchmark that tracks the performance of US dollar-denominated, fixed and floating-rate debt instruments issued by emerging market corporate entities.
JESG CEMBI Broad Div. Index - The JP Morgan ESG CEMBI Broad Diversified Custom Maturity Index tracks liquid, US Dollar denominated emerging market fixed and floating-rate debt instruments issued by corporates.
EM3B – ICE BofA BB Emerging Markets Corporate Plus Index is a subset of the ICE BofA Emerging Markets Corporate Plus Index including ass securities rated BB1 through BB3, inclusive.
EMCS – ICE BofA Emerging Markets Corporate Plus Consumer Index is a subset of ICE BofA Emerging Markets Corporate Plus Index including all securities of Consumer Cyclical and Consumer Non-Cyclical issuers.
EMEN – ICE BofA Emerging Market Corporate Plus Energy Index is a subset of ICE BofA Emerging Markets Corporate Plus Index including all securities of Energy issuers.
EMRB – ICE BofA Emerging Market Corporate plus Real Estate, Building & Hotels Index is a subset of ICE BofA Emerging Markets Corporate Plus Index including all securities of Real Easte, Building & Construction, or Hotels.
EMCG – ICE BofA Emerging Markets Corporate Plus Capital Goods Index is a subset of ICE BofA Emerging Markets Corporate Plus Index including all securities of Capital Goods Issuers.
EMSD – ICE BofA Emerging Markets Diversified Corporate Index tracks the performance of USD dollar denominated emerging markets corporate senior and secured debt publicly issued in the US domestic and eurobond markets.
EMTM – ICE BofA Emerging Markets Corporate Plus Media & Telecommunications Index is a subset of ICE BofA Emerging Markets Corporate Plus index including all securities of media and telecommunications issuers.
EM2B – ICE BofA BBB Emerging Markets Corporate Plus Index is a subset of the ICE BofA Emerging Market Corporate Plus index including all securities rated BBB1 through BBB3, inclusive.
EMUT – the ICE BofA Emerging Markets Corporate Plus Utility Index is a subset of the ICE BofA Emerging Markets Corporate Plus Index including all securities of Utility issuers.
EMPB – ICE BofA Public Sector Issuers Emerging Markets Corporate Plus Index is a subset of The BofA Emerging Markets Corporate Plus Index including all quasi-government securities as well as debt of corporate issuers deemed to be government owned or controlled.
ACIG – ICE BofA Asian Dollar Investment Grade Corporate Index tracks the performance of investment grade US dollar denominated securities issued by Asian corporate issuers in the US domestic and eurobonds market. Qualyfying securities have a country of risk associated with Bangladesh, Bhutan, Cambodia, China, John Kong, India, Indonesia, Laos, Macau, Malaysia, Mongolia, Myanmar, Nepal, Pakistan, Papua New Guinea, Philippines, Singapore, South Korea, Sri Lanka, Taiwan, Thailand and Vietnam.
EMAB – Ice BofA Automotive & Basic Industry Emerging Markets Corporate Plus Index is a subset of the ICE BofA Emerging Markets Corporate Plus Index.
EMHE - The ICE BofA High Yield EMEA Emerging Markets Corporate Plus Index is a subset of ICE BofA Emerging Markets Corporate Plus Index including all securities rated BBB3 and higher with a country of risk within the Europe, Middle East and Africa regions.
EMNS – The ICE BofA Non-Financial Emerging Markets Corporate Plus Index is a subset of the ICE BofA Emerging Markets Corporate Plus Index excluding all financial securities as well as debt of corporate issuers designated as government owned or controlled by ICE BofA emerging markets credit research.
EM1B – the ICE BofA AAA-A Emerging Markets Corporate Plus Index is a subset of the ICE BofA Emerging Market Corporate Plus Index including all securities rated AAA through A3, inclusive.
including all securities with India as the country of risk that are rated sub-investment grade based on average of Moody's, S&P and Fitch
ADOL -The ICE BofA Asian Dollar Index tracks the performance of U.S. dollar denominated sovereign, quasi-government, corporate, securitized and collateralized debt publicly issued in the U.S. domestic and eurobond markets by Asian issuers.
ICE BofA China Corporate Index (CN0C) ICE BofA China Corporate Index tracks the performance of CNY denominated corporate debt issued in the Chinese domestic bond market. Qualifying securities must have at least one year remaining term to final maturity, at least 18 months to final maturity at point of issuance, a fixed coupon schedule and a minimum amount outstanding of CNY 500 million. Callable perpetual securities qualify provided they are at least one year from the first call date. Fixed-to-floating rate securities also qualify provided they are callable within the fixed rate period and are at least one year from the last call prior to the date the bond transitions from a fixed to a floating rate security. Contingent capital securities (“cocos”) are excluded, but capital securities where conversion can be mandated by a regulatory authority, but which have no specified trigger, are included. Other hybrid capital securities, such as those issues that potentially convert into preference shares, those with both cumulative and non-cumulative coupon deferral provisions, and those with alternative coupon satisfaction mechanisms, are also included in the index. Securities in legal default are excluded from the Index.
ICE BofA Investment Grade Emerging Markets Corporate Plus China Issuers Index (ECNI) ICE BofA Investment Grade Emerging Markets Corporate Plus China Issuers Index is a subset of ICE BofA Emerging Markets Corporate Plus Index including all securities with China as the country of risk that are rated investment grade based on average of Moody's, S&P and Fitch. EMFN – EM Corporate Plus Financial is a subset of ICE BofA Emerging Markets Corporate Plus Index including all securities of financial issuers.
EMIE - The ICE BofA High Grade EMEA Emerging Markets Corporate Plus Index is a subset of ICE BofA Emerging Markets Corporate Plus Index including all securities rated BBB3 and higher with a country of risk within the Europe, Middle East and Africa regions.
EM4B – ICE BofA B & Lower Emerging Markets Corporate Plus Index is a subset of the ICE BofA Emerging Markets Corporate Plus Index.
EMRT – ICE BofA Emerging Markets Corporate Plus Transportation Index is a subset of ICE BofA Emerging Markets Corporate Plus Index including all securities of Transportation issuers other than airlines or railroads.
GSFCI - The Goldman Sachs Financial Conditions Index is a measure that assesses the overall financial conditions in the economy, taking into account various factors such as interest rates, credit spreads, and equity prices.
ICE BofA B Asian Dollar High Yield Index (ACH2) ICE BofA B Asian Dollar High Yield Index is a subset of ICE BofA Asian Dollar High Yield Corporate Index including all securities rated B1 through B3, inclusive.
ICE BofA Single-B US Cash Pay High Yield Index (J0A2) ICE BofA Single-B US Cash Pay High Yield Index is a subset of ICE BofA US Cash Pay High Yield Index including all securities rated B1 through B3, inclusive.
You cannot invest directly in an index, which also does not take into account trading commissions or costs. Additionally, indices do not include reinvestment of dividends, and the volatility of indices may be materially different over time.
Important information
Muzinich and/or Muzinich & Co. referenced herein is defined as Muzinich & Co., Inc. and its affiliates. Muzinich views and opinions. This material has been produced for information purposes only and as such the views contained herein are not to be taken as investment advice. Opinions are as of date of publication and are subject to change without reference or notification to you. Past performance is not a reliable indicator of current or future results and should not be the sole factor of consideration when selecting a product or strategy. The value of investments and the income from them may fall as well as rise and is not guaranteed and investors may not get back the full amount invested. Rates of exchange may cause the value of investments to rise or fall.
Any research in this document has been obtained and may have been acted on by Muzinich for its own purpose. The results of such research are being made available for information purposes and no assurances are made as to their accuracy. Opinions and statements of financial market trends that are based on market conditions constitute our judgment and this judgment may prove to be wrong. The views and opinions expressed should not be construed as an offer to buy or sell or invitation to engage in any investment activity, they are for information purposes only.
This discussion material contains forward-looking statements, which give current expectations of future activities and future performance. Any or all forward-looking statements in this material may turn out to be incorrect. They can be affected by inaccurate assumptions or by known or unknown risks and uncertainties. Although the assumptions underlying the forward-looking statements contained herein are believed to be reasonable, any of the assumptions could be inaccurate and, therefore, there can be no assurances that the forward-looking statements included in this discussion material will prove to be accurate. In light of the significant uncertainties inherent in the forward-looking statements included herein, the inclusion of such information should not be regarded as a representation that the objectives and plans discussed herein will be achieved. Further, no person undertakes any obligation to revise such forward-looking statements to reflect events or circumstances after the date hereof or to reflect the occurrence of unanticipated events.
United States: This material is for Institutional Investor use only – not for retail distribution. Muzinich & Co., Inc. is a registered investment adviser with the Securities and Exchange Commission (SEC). Muzinich & Co., Inc.’s being a Registered Investment Adviser with the SEC in no way shall imply a certain level of skill or training or any authorization or approval by the SEC.
United Arab Emirates (UAE): This information is provided for discussion and informational purposes only and does not constitute an offer or solicitation in the UAE. It is intended solely for Professional Investors and should not be relied upon by any other person. This material has not been reviewed or approved by the UAE Securities and Commodities Authority, the UAE Central Bank or any other relevant authority. Nothing contained herein constitutes investment, legal, tax or other professional advice. Recipients should make their own independent assessment where appropriate.
Abu Dhabi Global Market (ADGM): This information is provided for discussion and informational purposes only and does not constitute an offer or solicitation in the ADGM. It is intended solely for Professional Clients (as defined by the Financial Services Regulatory Authority) and should not be relied upon by any other person. This material has not been reviewed or approved by the Financial Services Regulatory Authority or any other relevant authority in the UAE.
DIFC: This material is intended solely for Professional Clients as defined by the Rules of the Dubai Financial Services Authority ("DFSA") and must not be delivered to, or relied upon by, any other person, including Retail Clients. It is provided for information and discussion purposes only and does not constitute an offer, solicitation, recommendation or investment advice, nor should it be construed as such.
Where this material relates to a fund or investment product, it may not be suitable for all investors and prospective investors should conduct their own due diligence and seek independent professional advice prior to making any investment decision. Where this material is distributed by a firm authorised and regulated by the DFSA, it is communicated in accordance with applicable DFSA rules.
Issued in the European Union by Muzinich & Co. (Ireland) Limited, which is authorized and regulated by the Central Bank of Ireland. Registered in Ireland, Company Registration No. 307511. Registered address: 32 Molesworth Street, Dublin 2, D02 Y512, Ireland. Issued in Switzerland by Muzinich & Co. (Switzerland) AG. Registered in Switzerland No. CHE-389.422.108. Registered address: Tödistrasse 5, 8002 Zurich, Switzerland. Issued in Singapore and Hong Kong by Muzinich & Co. (Singapore) Pte. Limited, which is licensed and regulated by the Monetary Authority of Singapore. Registered in Singapore No. 201624477K. Registered address: 6 Battery Road, #26-05, Singapore, 049909. Issued in all other jurisdictions (excluding the U.S.) by Muzinich & Co. Limited. which is authorized and regulated by the Financial Conduct Authority. Registered in England and Wales No. 3852444. Registered address: 8 Hanover Street, London W1S 1YQ, United Kingdom. 2026-11-17-19886

Key takeaways
Pick by objective: Sovereigns for a rates view; corporates for more efficient, better-diversified spread.
By clicking "Submit", I am (i) signing up to receive the Opinion Pieces from the "Opinions" page of the Muzinich & Co website, (ii) representing that the above information is true and accurate and (iii) agreeing to join the Muzinich & Co mailing list. I understand that Muzinich & Co will not add retail investors or individuals with personal email addresses to its mailing list and represent that I am not a retail investor. By providing my personal and professional information I am consenting to its use and disclosure in accordance with the Muzinich & Co. Privacy Policy. I understand that I may withdraw my consent and unsubscribe from receiving future communications by clicking "Unsubscribe" from the emails that are sent to me from Muzinich & Co.

Oct 16, 2026
EM monthly - Latin America makes the “Right Turn”
A political shift to the right is reshaping Latin America, raising expectations of more market-friendly policies, greater fiscal discipline and closer ties with Washington. With Brazil potentially the latest country to follow suit, could this realignment create a virtuous cycle of investment, growth and improving credit fundamentals across the region?

Sep 07, 2026
Asia Credit: An underappreciated opportunity
Asia credit combines the growth potential of emerging markets with the quality characteristics of developed markets. Supported by resilient fundamentals, favourable technicals and powerful structural trends, the asset class offers a compelling opportunity for investors seeking diversification, income and long-term capital preservation explains Mel Siew.

Jul 30, 2026
Emerging Markets: The Half-Time Team Talk
What does a football half-time team talk have in common with emerging market credit? In our latest Muzinich Podcast, Warren Hyland, Head of Emerging Markets, uses the football-inspired framework from his latest Emerging Markets Monthly, Half Time, to reflect on the first six months of the year and discuss the outlook for the remainder of 2026.