Muzinich weekly market comment: Weather station view
Insight
March 30, 2026
If you have any feedback on this article or are interested in subscribing to our content, please contact us at opinions@muzinich.com or fill out the form on the right hand side of this page.
--------
We are now four weeks into the Iran conflict, which began on 28 February. What makes this episode uniquely difficult to assess – both in terms of its duration and its ultimate economic impact – is a pair of structural characteristics that set it apart from the most recent event market shocks.
Consider the resolution dynamics of those prior crises. The “Liberation Day” tariff shock, for all its severity, effectively had a single point of control, and therefore a single point of resolution. One individual, Donald Trump, held the policy lever and could adjust it in either direction. Markets understood this, which is why volatility subsided rapidly once the rhetoric began to shift.
The COVID-19 pandemic, by contrast, was a true humanitarian and economic shock. Yet it prompted an extraordinary level of institutional coordination. Governments, central banks, the International Money Fund (IMF), the World Health Organization (WHO) and other global bodies moved with a shared objective and urgency. The scale of the disruption was immense, but so too was the unity of the response.
The Iran conflict possesses neither of these stabilizing features. It cannot be resolved by a single decision-maker, nor is there a cohesive alignment around either a swift military resolution or a coordinated economic backstop. This brings us to the second challenge: how to separate signal from noise, given that communication from all sides is designed as much to signal strength as to advance a settlement.
The communication flow last week was – to put it charitably – deeply contradictory. From the US side, the rhetoric shifted meaningfully; away from the language of acceleration and ramp-up, toward talk of wind-downs, deal-making and off-ramps. Reports of a 15-point US framework covering the dismantling of Iran's nuclear facilities, the reopening of the Strait of Hormuz and a broader regional settlement gave markets a constructive narrative on which to lean.1 A further boost came from the announcement of a planned summit between Donald Trump and Xi Jinping in Beijing on 14–15 May. Following delays caused by the conflict itself, this development added to a growing sense of confidence that the US administration is confident a diplomatic framework is beginning to take shape.2
Yet this sits uneasily alongside the operational picture. Self-imposed escalation deadlines remain on the table, and the continued, significant movement of US military personnel into the theatre is not the footprint of a party preparing to stand down.3 The Iranian position is no less opaque. Official military statements have been unequivocal; denying both interest in, and any contact regarding, a ceasefire. However, that stance appeared to soften conditionally when the Iran government acknowledged its core demands linked to security guarantees and formal recognition of its authority over the Strait of Hormuz. Adding further complexity, reporting from Reuters suggests that Iran has since insisted on Lebanon’s inclusion in any ceasefire framework, effectively linking this conflict to broader regional settlement.4
If we attempt to filter out the noise by viewing the Iran conflict from a great height – imagine a weather station in space, elevated above the storm clouds entirely – a clearer picture begins to emerge (see Chart of the Week).
From this perspective, it is evident that markets are now at the centre of the storm. The windows are rattling. Our preferred sentiment gauge, the VIX, has moved above 30, a classic signal that uncertainty has become elevated. At the same time, bearish sentiment has risen sharply. The American Association of Individual Investors survey (AAII), which tracks retail investor expectations over a six-month horizon, has shifted decisively from optimism to pessimism over the past four weeks.5
In commodity markets, energy prices have continued to rise but remain broadly consistent with our supply shock framework. Food prices have also increased, highlighting the risk that fertilizer shortages could begin to impact future harvests. Precious metals, however, tell a different story. Gold recorded its worst month since 2008, while silver has lost over a quarter of its value. This pattern is not unusual: gold often rallies into periods of heightened event risk, but once the event materializes, it is frequently used as a source of liquidity, either to fund losses in risk assets, or to meet margin calls.
In fixed income, the adjustment has been equally pronounced. Since the onset of the conflict, government bond markets (Japan aside), have experienced aggressive bear flattening. Two-year yields have risen sharply: UK gilts by around 100 basis points (bps), German Schatz by 68bps and US Treasuries by 57bps. This repricing reflects markets responding to central bank communication aimed at anchoring inflation expectations. Both the Monetary Policy Committee (MPC) and the European Central Bank (ECB) are now expected to deliver roughly 75bps of tightening, while investors are giving a 40% probability to the Federal Open Market Committee (FOMC) hiking 25bps this year.6
Dissecting the 2-year US Treasury, its inflation component has moved from 2.81% to 3.27%, suggesting over the next two years there may be danger that the conflict could approximately add 0.5% to consumer prices. However, this inflation is considered temporary; at the 10-year point, inflation is only picking up 7bps and is unchanged with the 30-year point at 2.19%. This suggests that central banks have done a good job at anchoring inflation expectations and that the conflict has a limited time frame.
Corporate credit market spreads have widened, although the moves have been relatively contained compared to previous episodes of event-driven stress. Credit spreads have widened slightly more than Europe than in US credit. In total return terms, investment grade has underperformed, driven primarily by the rise in underlying government yields; that is, the longer the duration of the index, the greater the drawdown. This leaves US credit as the underperformer in investment grade, with emerging market sovereign debt underperforming its corporate peer.
One important nuance lies in the behaviour of real yields. Across the US curve, real yields (growth) have moved higher; at the 10-year point, real yields have risen from 1.68% to 2.11%. This suggests that markets are not pricing a meaningful deterioration in growth, but rather the opposite. This may help explain the limited widening in credit spreads, which are typically more sensitive to growth expectations, while also reinforcing the idea that this conflict may be short lived.
The view from our weather station is nuanced but consistent. It seems this is being treated as a contained, inflationary geopolitical shock, rather than the start of a broader economic downturn. Implicitly, markets appear to be pricing a scenario in which the conflict is resolved within a finite timeframe of between 4–8 weeks and, perhaps more controversially, that a resolution could remove longer-term geopolitical risks and could, therefore, ultimately be economically constructive.
It is also worth noting that from our weather station, the Iran conflict is not the only storm cloud on the horizon. The private credit storm has been quietly building. This is a liquidity storm that will play out over the next 12–18 months. While on the far horizon, vast and still gathering, is the AI disruption supercell. It is the largest system in the sky by an order of magnitude, yet remains distant, with its true scale not easy to estimate. With its force likely to be felt across labour markets, entire industries and capital allocation, this is a thematic storm that will play out over the next 3 to 5 years.
We note that we will pause the Muzinich Weekly Comment due to the Bank Holiday. We look forward to resumption of the Muzinich Weekly Comment on April 13.
Chart of the Week: View from the weather station
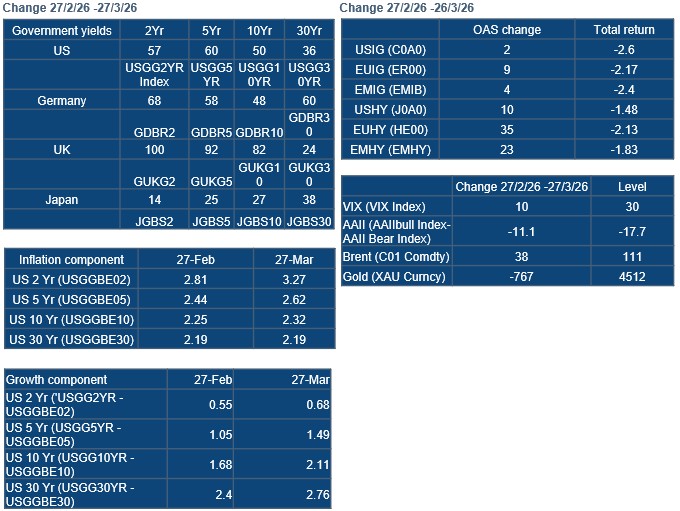
Source: Bloomberg and ICE Index Platform, as of 26th and/or 27th March (where specified). See index descriptions at the end of this document for full index names and descriptions. Indices used represent best proxies for markets being discussed. For illustrative purposes only.
All sources are Bloomberg unless otherwise stated.
Past performance is not a reliable indicator of current or future results.
References to specific companies is for illustrative purposes only and does not reflect the holdings of any specific past or current portfolio or account.
References
1. Bloomberg, “US Demands Iran Dismantle Nuclear Sites as Part of 15-Point Plan,” March 25, 2026
2. Bloomberg, “Trump to Travel to China on May 14-15 for Summit with Xi,” March 26, 2026
3. Bloomberg, “US Troop Movements Fan Fears of a Risky Ground Attack on Iran,” March 25, 2026
4. Reuters, “Iran wants Lebanon included in any ceasefire, sources say,” March 25, 2026
5. AAII Sentiment Survey: Pessimism Pulls Back, as of 26th March 2026. AAII Staff.
6. Bloomberg as of March 27, 2026
This material is not intended to be relied upon as a forecast, research, or investment advice, and is not a recommendation, offer or solicitation to buy or sell any securities or to adopt any investment strategy. The opinions expressed by Muzinich & Co. are as of March 27 2026 and may change without notice.
--------
Index descriptions
USGG2YR Index - US Generic Govt 2 Yr
USGG5YR Index - US Generic Govt 5 Yr
USGG10YR Index - US Generic Govt 10 Yr. Legacy Government (Sovereign) Generic Index-key ticker.
USGG30YR Index -US Generic Govt 30 Yr
GDBR2 Index - GERMANY GOVT BND 2 YR BKO
GDBR5 Index - GERMANY GOVT BND 5 YR OBL
GDBR10 Index - Germany Govt Bnd 10 Yr DBR. Legacy Government (Sovereign) Generic Index-key ticker.
GDBR30 Index - GERMANY GOVT BND 30 YR DBR
GUKG2 Index - UK Gilts 2 Year
GUKG5 Index - UK Gilts 5 Year
GUKG10 Index - UK Gilts 10 Year
GUKG30 Index - UK Gilts 30 Year
JGBS2 Index - Japan Govt Bond 2Yr
JGBS5 Index - Japan Govt Bond 5Yr
JGBS10 Index - Japan Govt Bond 10Yr
JGBS30 Index - Japan Govt Bond 30Yr
USGGBE02 Index - US Breakeven 2 Year
USGGBE05 Index - US Breakeven 5 Year
USGGBE10 Index - US Breakeven 10 Year
USGGBE30 Index - US Breakeven 30 Year
VIX INDEX - Cboe Volatility Index
AAIIBULL Index - AAII US Investor Sentiment Bullish Readings
AAIIBEAR Index - AAII US Investor Sentiment Bearish Readings
ER00 - The ICE BofA Euro Corporate Index tracks the performance of EUR denominated investment grade corporate debt publicly issued in the eurobond or Euro member domestic markets. Qualifying securities must have an investment grade rating (based on an average of Moody’s, S&P and Fitch), at least 18 months to final maturity at the time of issuance, at least one year remaining term to final maturity, a fixed coupon schedule and a minimum amount outstanding of EUR 250 million.
EMIB - The ICE BofA High Grade Emerging Markets Corporate Plus index is a subset of the ICE BofA Emerging Markets Corporate Plus Index (EMCB) including all securities rated AAA through BBB3, inclusive.
J0A0 - The ICE BofA US Cash Pay High Yield Index tracks the performance of US dollar denominated below investment grade corporate debt, currently in a coupon paying period that is publicly issued in the US domestic market. Qualifying securities must have a below investment grade rating (based on an average of Moody’s, S&P and Fitch), at least 18 months to final maturity at the time of issuance, at least one year remaining term to final maturity as of the rebalancing date, a fixed coupon schedule and a minimum amount outstanding of $250 million.
HE00 - - The ICE BofA Euro High Yield Index tracks the performance of EUR dominated below investment grade corporate debt publicly issued in the euro domestic or eurobond markets. Qualifying securities must have a below investment grade rating (based on an average of Moody’s, S&P and Fitch), at least 18 months to final maturity at the time of issuance, at least one year remaining term to final maturity, a fixed coupon schedule and a minimum amount outstanding of EUR 250 million.
EMHY - The ICE BofA High Yield US Emerging Markets Liquid Corporate Plus Index is a subset of The ICE BofA US Emerging Markets Liquid Corporate Plus Index including all securities rated BB1 or lower. The ICE BofA US Emerging Markets Liquid Corporate Plus Index tracks the performance of U.S. dollar denominated emerging markets non-sovereign debt publicly issued in the major domestic and eurobond markets.
--
Important Information
Muzinich & Co., “Muzinich” and/or the “Firm” referenced herein is defined as Muzinich & Co. Inc. and its affiliates. This material has been produced for information purposes only and as such the views contained herein are not to be taken as investment advice. Opinions are as of date of publication and are subject to change without reference or notification to you. Past performance is not a reliable indicator of current or future results and should not be the sole factor of consideration when selecting a product or strategy. The value of investments and the income from them may fall as well as rise and is not guaranteed and investors may not get back the full amount invested. Rates of exchange may cause the value of investments to rise or fall. Emerging Markets may be more risky than more developed markets for a variety of reasons, including but not limited to, increased political, social and economic instability, heightened pricing volatility and reduced market liquidity. Any research in this document has been obtained and may have been acted on by Muzinich for its own purpose. The results of such research are being made available for information purposes and no assurances are made as to their accuracy. Opinions and statements of financial market trends that are based on market conditions constitute our judgment and this judgment may prove to be wrong. The views and opinions expressed should not be construed as an offer to buy or sell or invitation to engage in any investment activity, they are for information purposes only. Any forward-looking information or statements expressed in the above may prove to be incorrect. In light of the significant uncertainties inherent in the forward-looking statements included herein, the inclusion of such information should not be regarded as a representation that the objectives and plans discussed herein will be achieved. Muzinich gives no undertaking that it shall update any of the information, data and opinions contained in the above.
United States: This material is for Institutional Investor use only – not for retail distribution. Muzinich & Co., Inc. is a registered investment adviser with the Securities and Exchange Commission (SEC). Muzinich & Co., Inc.’s being a Registered Investment Adviser with the SEC in no way shall imply a certain level of skill or training or any authorization or approval by the SEC.
In the United Arab Emirates (UAE) (excluding the Dubai International Financial Centre (DIFC) and the Abu Dhabi Global Market (ADGM): This document, and the information contained herein, does not constitute, and is not intended to constitute, a public offer of securities in the United Arab Emirates (“UAE”) and accordingly should not be construed as such. The Units are only being offered to a limited number of exempt Professional Investors in the UAE who fall under one of the following categories: federal or local governments, government institutions and agencies, or companies wholly owned by any of them. The Units have not been approved by or licensed or registered with the UAE Central Bank, the SCA, the Dubai Financial Services Authority, the Financial Services Regulatory Authority or any other relevant licensing authorities or governmental agencies in the UAE (the “Authorities”). The Authorities assume no liability for any investment that the named addressee makes as a Professional Investor. The document is for the use of the named addressee only and should not be given or shown to any other person (other than employees, agents or consultants in connection with the addressee’s consideration thereof).
In the United Arab Emirates (UAE) (including the Dubai International Financial Centre and the Abu Dhabi Global Market): This information does not constitute or form part of any offer to issue or sell, or any solicitation of any offer to subscribe for or purchase, any securities or investment products in the UAE and accordingly should not be construed as such. Furthermore, this information is being made available on the basis that the recipient is an entity fully regulated by the ADGM Financial Services Regulatory Authority (FSRA), and acknowledges and understands that the entities and securities to which it may relate have not been approved, licensed by or registered with the UAE Central Bank, the Dubai Financial Services Authority, the UAE Securities and Commodities Authority, the Financial Services Regulatory Authority or any other relevant licensing authority or governmental agency in the UAE. The content of this report has not been approved by or filed with the UAE Central Bank, the Dubai Financial Services Authority, the UAE Securities and Commodities Authority or the Financial Services Regulatory Authority.
Issued in the European Union by Muzinich & Co. (Ireland) Limited, which is authorized and regulated by the Central Bank of Ireland. Registered in Ireland, Company Registration No. 307511. Registered address: 32 Molesworth Street, Dublin 2, D02 Y512, Ireland. Issued in Switzerland by Muzinich & Co. (Switzerland) AG. Registered in Switzerland No. CHE-389.422.108. Registered address: Tödistrasse 5, 8002 Zurich, Switzerland. Issued in Singapore and Hong Kong by Muzinich & Co. (Singapore) Pte. Limited, which is licensed and regulated by the Monetary Authority of Singapore. Registered in Singapore No. 201624477K. Registered address: 6 Battery Road, #26-05, Singapore, 049909. Issued in all other jurisdictions (excluding the U.S.) by Muzinich & Co. Limited. which is authorized and regulated by the Financial Conduct Authority. Registered in England and Wales No. 3852444. Registered address: 8 Hanover Street, London W1S 1YQ, United Kingdom.