Tracking China’s credit recovery
EM Monthly
November 18, 2025
If you have any feedback on this article or are interested in subscribing to our content, please contact us at opinions@muzinich.com or fill out the form on the right hand side of this page.
--------
Tracy Zhao and Mel Siew review how Chinese credit has performed and where’s its headed, as the Chinese economy shows some green shoots.
After a turbulent few years marked by trade tensions, shifting policy priorities and a prolonged property downturn, investors are watching China closely for signs of a sustained recovery. A series of bold stimulus measures have helped reignite optimism and fuel a revival across markets - from credit and equities to broader investor sentiment. Yet, beneath the surface, questions remain about how durable this rebound will be amid renewed US - China friction and a delicate policy balancing act at home.
Tit for tat tariffs
Upbeat sentiment towards China began in September 2024, when the country unveiled substantial stimulus packages which were warmly received by investors.1 Positive momentum carried into 2025, boosted by a wave of companies choosing Hong Kong for secondary and IPO equity offerings, resulting in the Hang Seng being the world’s best performing stock market year-to-date.2 China’s technology sector also demonstrated innovation on a par with the US, following DeepSeek’s ground-breaking January release.3
All this occurred despite renewed US-China trade tensions. However, despite volatility ebbing and flowing as each side applied tit for tat tariffs (Figure 1), a Trump-Xi meeting in October restored calm for the year ahead.4
Figure 1:Development of US tariff hikes on China
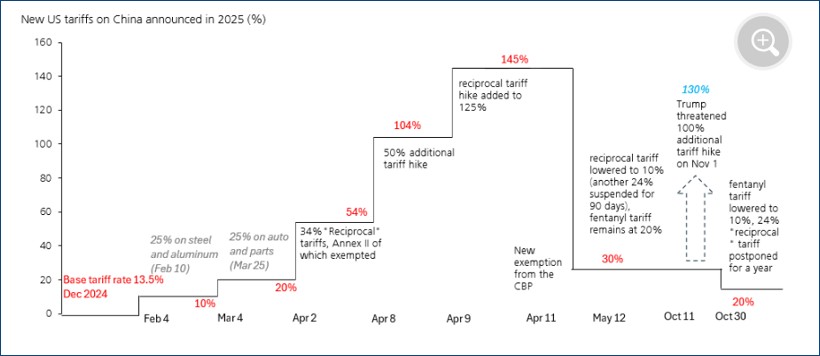
Source: UBS Global Research, as of 30th October 2025 - “China Economic Perspectives”. For illustrative purposes only.
Recovery gains pace
A Z-score measures how far a data point is from its average, showing whether it’s above or below normal and by how much. Revisiting our China Z-Score, which we first introduced in March 2024, we observe a steady improvement since mid-2023, with a notable surge in August and September 2024 following the announcement of the stimulus package (Figure 2). In 2025, the score has generally remained in positive territory, suggests the overall momentum of China’s economy is strengthening, albeit with significant volatility.
In the first half of the year, consumption was a driver, supported by the expansion of trade-in schemes to include consumer electronics. As policy impulses waned, market and sentiment indicators gained greater prominence (Figure 3), suggesting wealth effects may now be playing a greater role. Property has not been a meaningful contributor overall, although it recently turned slightly negative, while inflation remained the largest drag.
Figure 2: Improving Z-score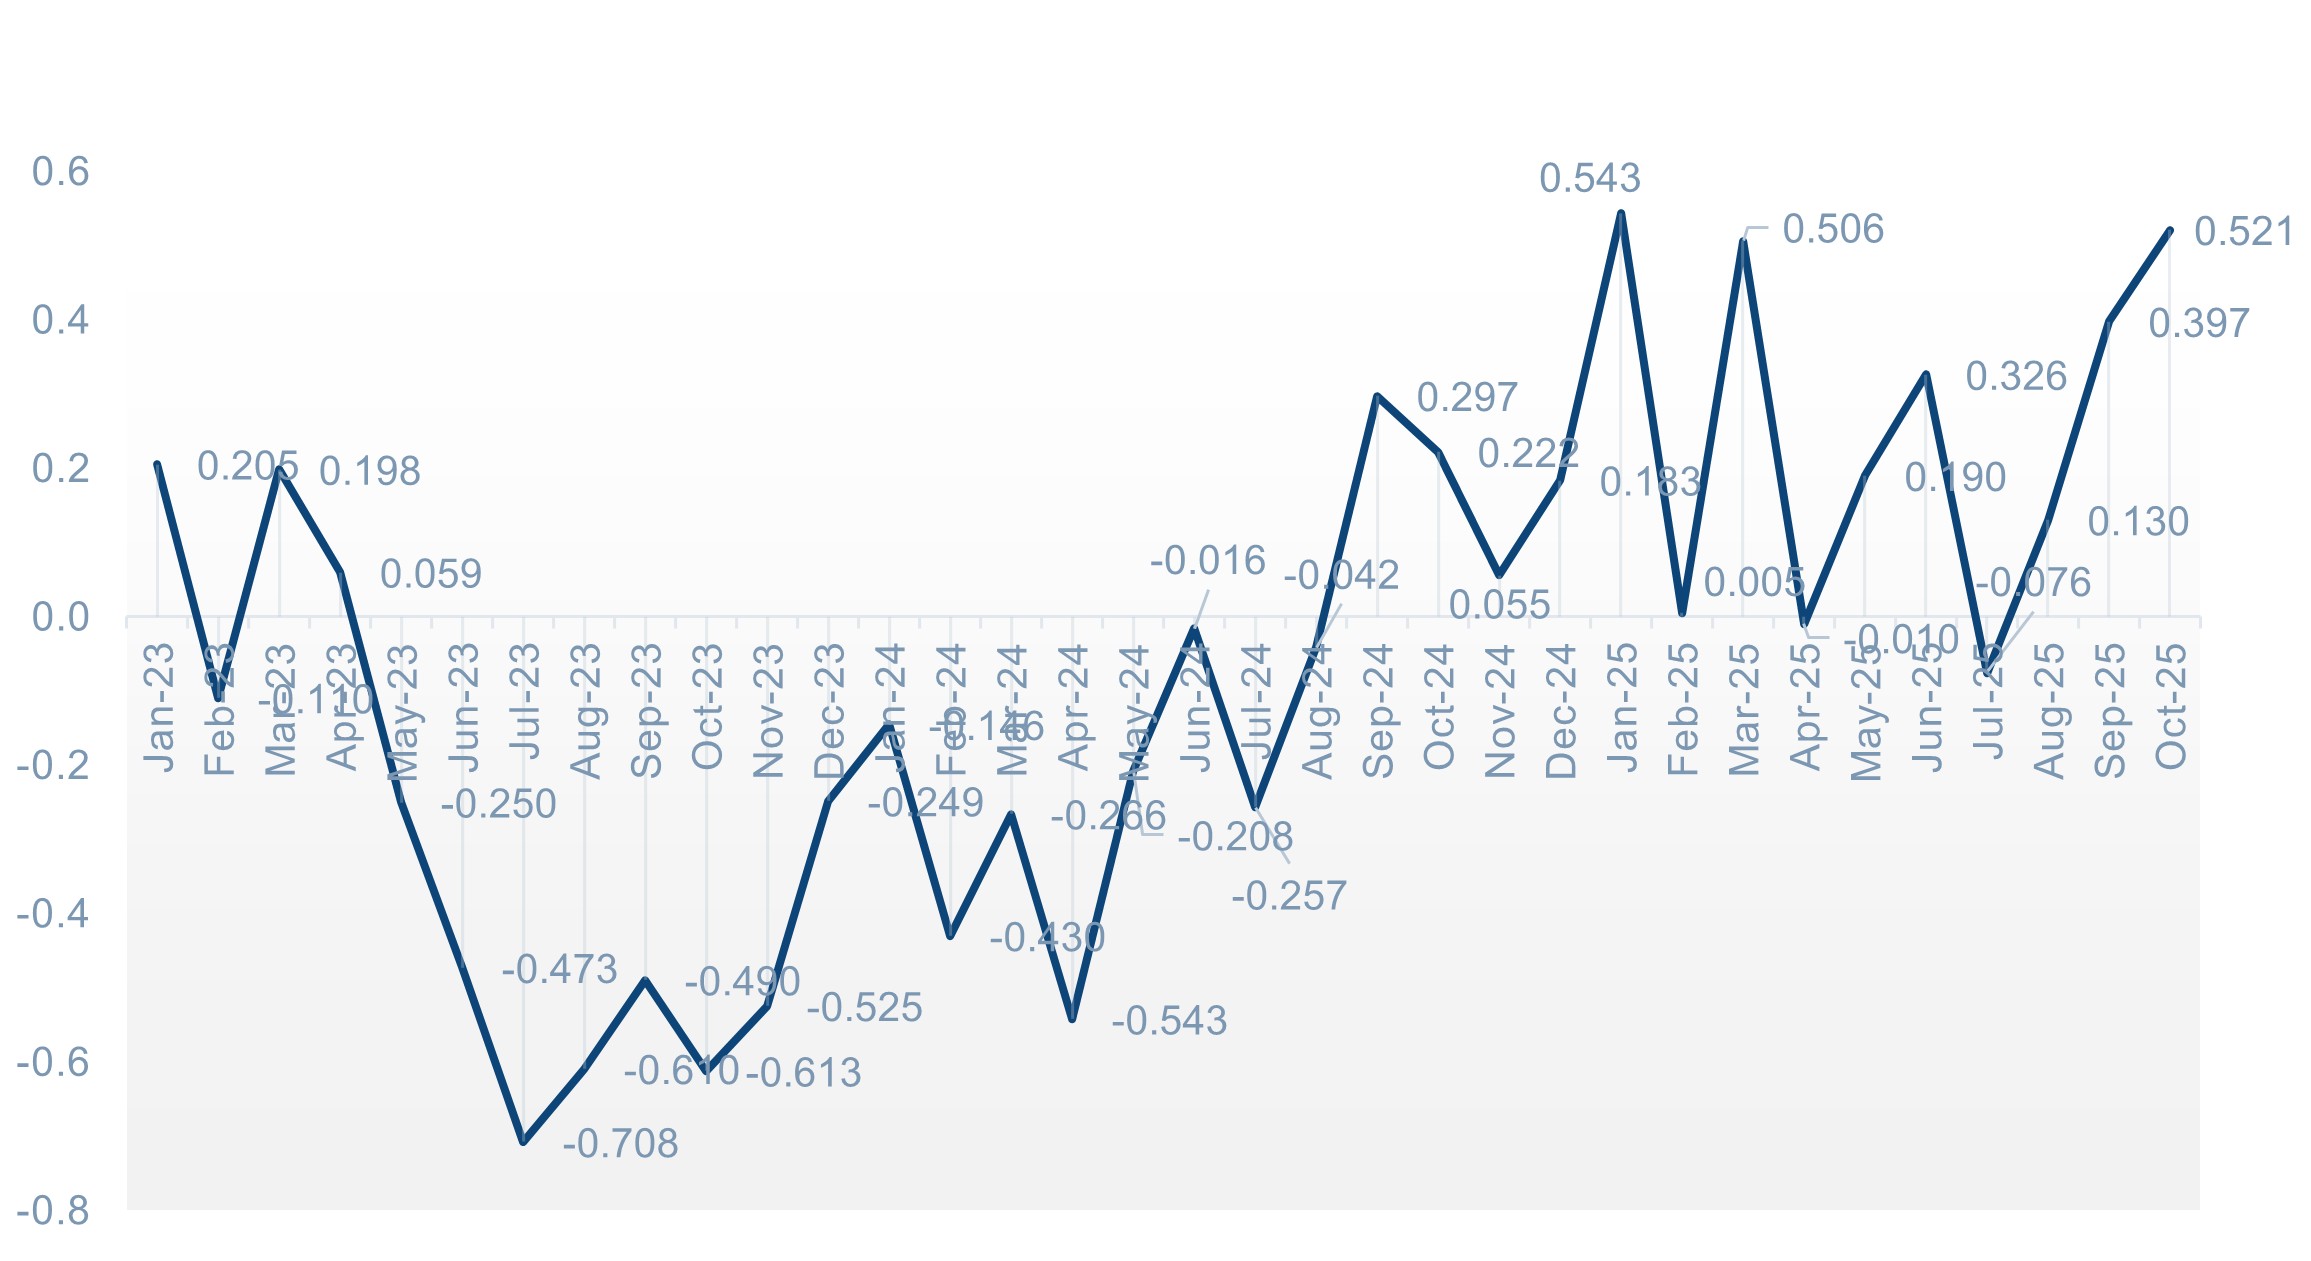
Source: Muzinich & Co, as of 30th September 2025. Latest available data used. For illustrative purposes only.
Figure 3: Heatmap indicates improvements in China’s economy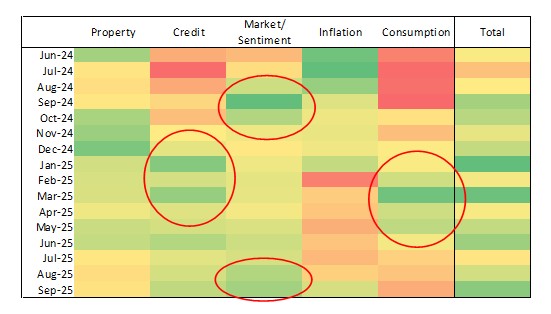 Source: Muzinich & Co, as of 31st October 2025. Latest available data used. For illustrative purposes only.
China’s credit rebound
Improvements in China’s economy also appear to be feeding through into the credit market.
Despite a starting yield that was lower than the US investment grade (IG) market, year-to-date returns from Chinese IG are comparable (Figure 4). With lower volatility, unsurprising given the lower duration of Chinese IG (4.2yrs vs, 6.5yrs of USIG5) Chinese IG has a higher Sharpe ratio.6 his result holds over 1yr, 3yr, 5yr and 10yr time horizons.6
Figure 4: China IG performance on a par with US IG
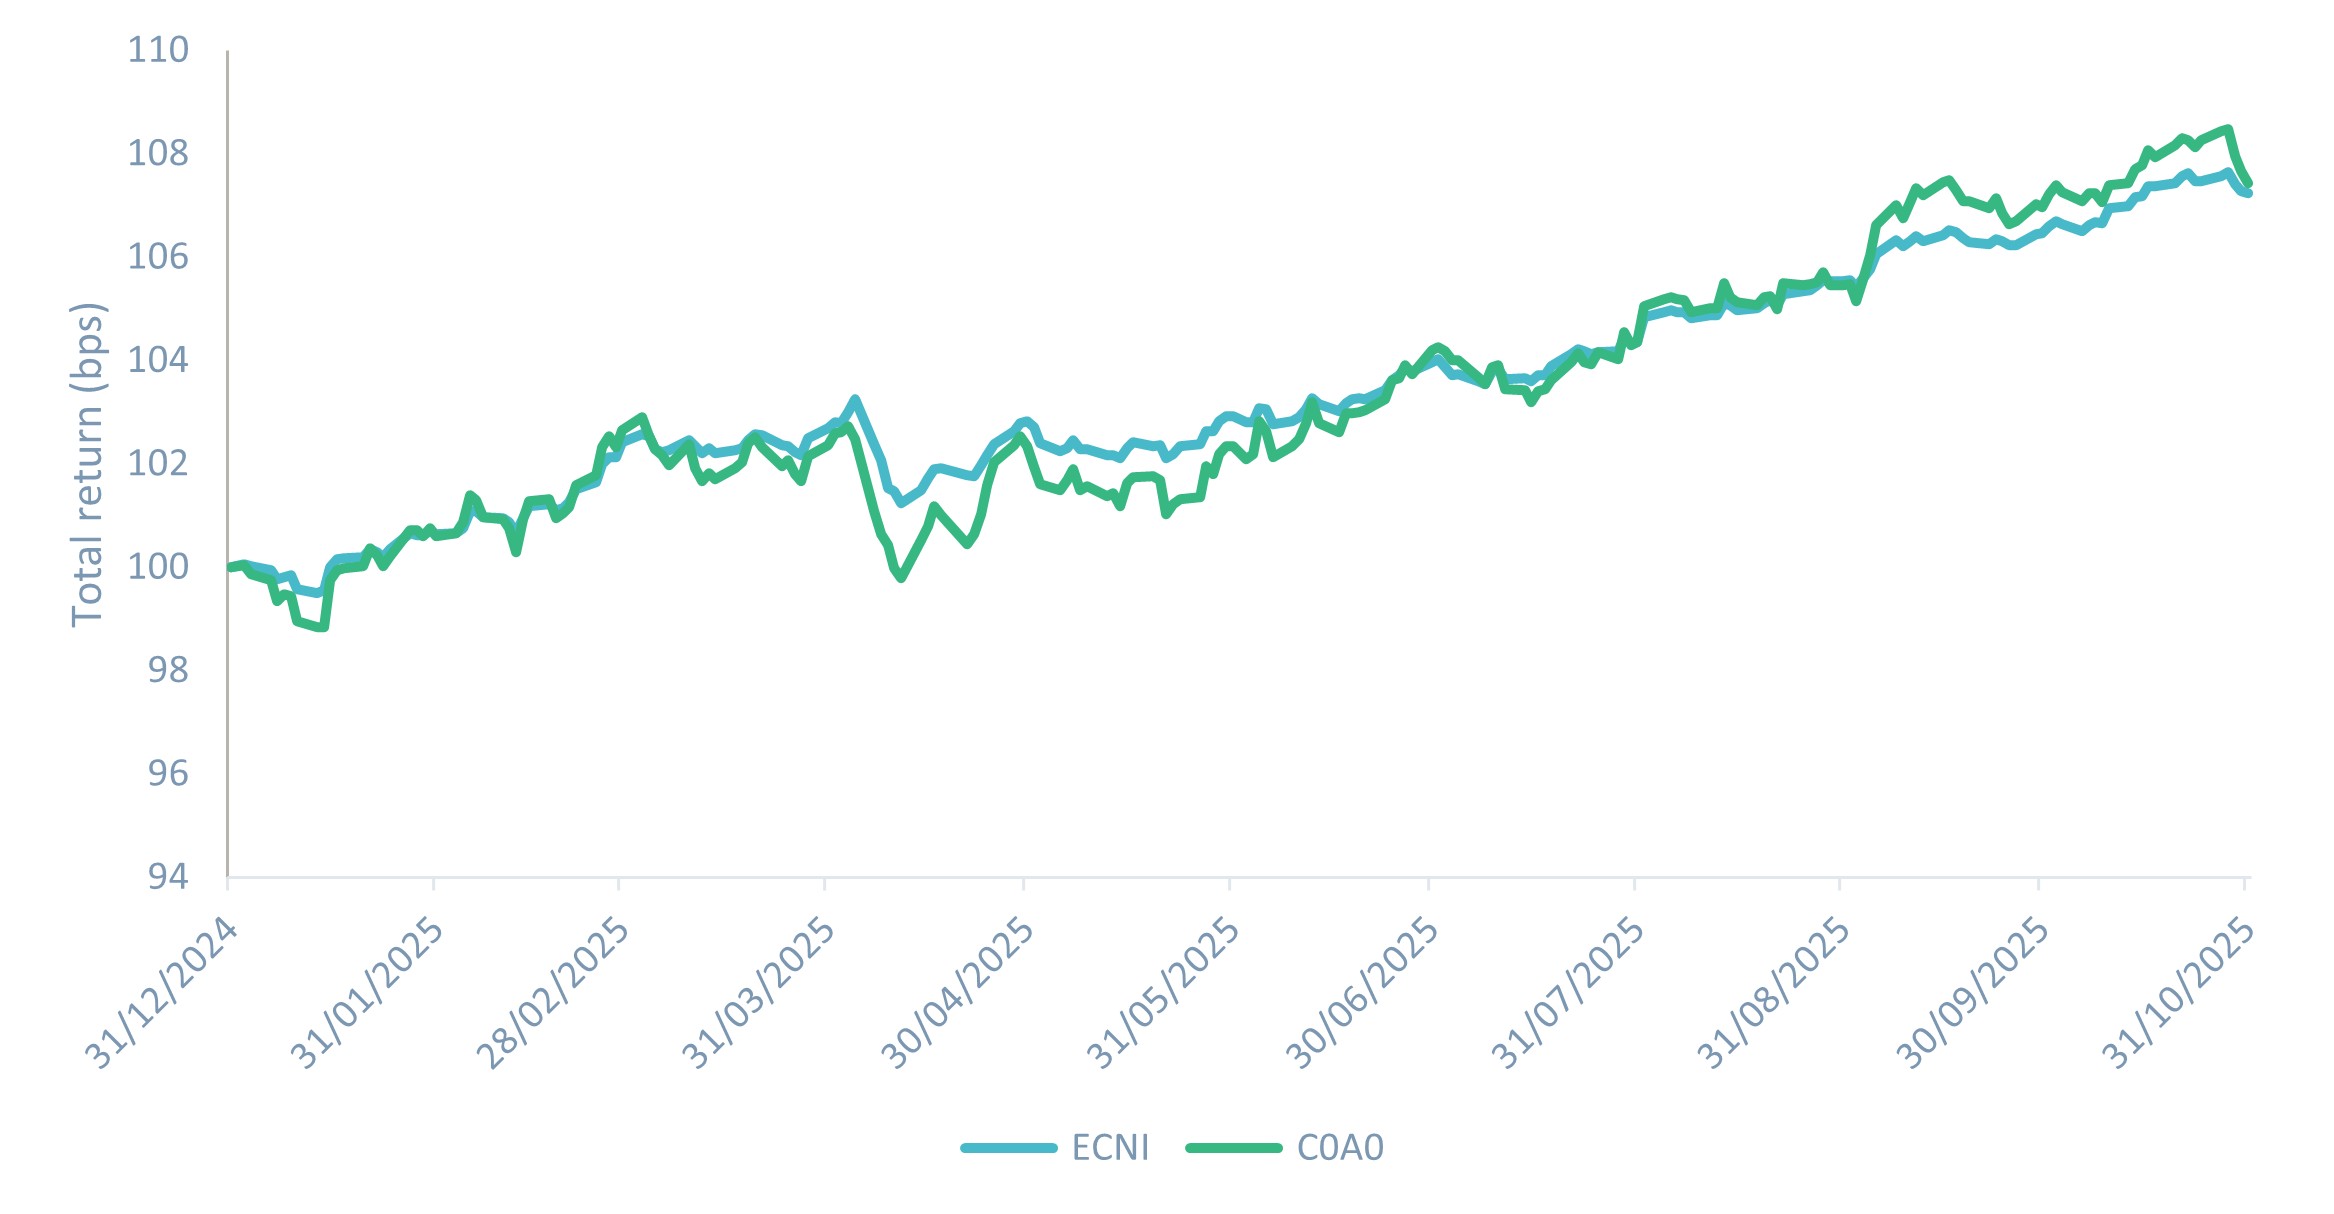
Past performance is not a reliable indicator of current or future results.
Source: ICE Index Platform, as of 31st October 2025. ICE BofA US Corporate Index (C0A0), ICE BofA Investment Grade Emerging Markets Corporate Plus China Issuers Index (ECN1). Indices selected represent best proxy for US and China IG markets. Index performance is for illustrative purposes only. You cannot invest directly in the index.
In high yield (HY), Asian HY has been the best regional performer over the past three years, with China HY the best performing sub-asset class.7 As we have argued in the past, stress from the Chinese property sector unduly impacted the rest of Chinese HY. However, the property sector is now much smaller at just 6% of the market, down from 55% at the end of 2020.7 As a result, since 2023, Chinese BBs and US BBs spreads have compressed and are now just 100bps (Figure 5), showing a marked improvement in performance compared to 2015-17.7
Figure 5: Spread compression in Chinese BBs vs. US BBs
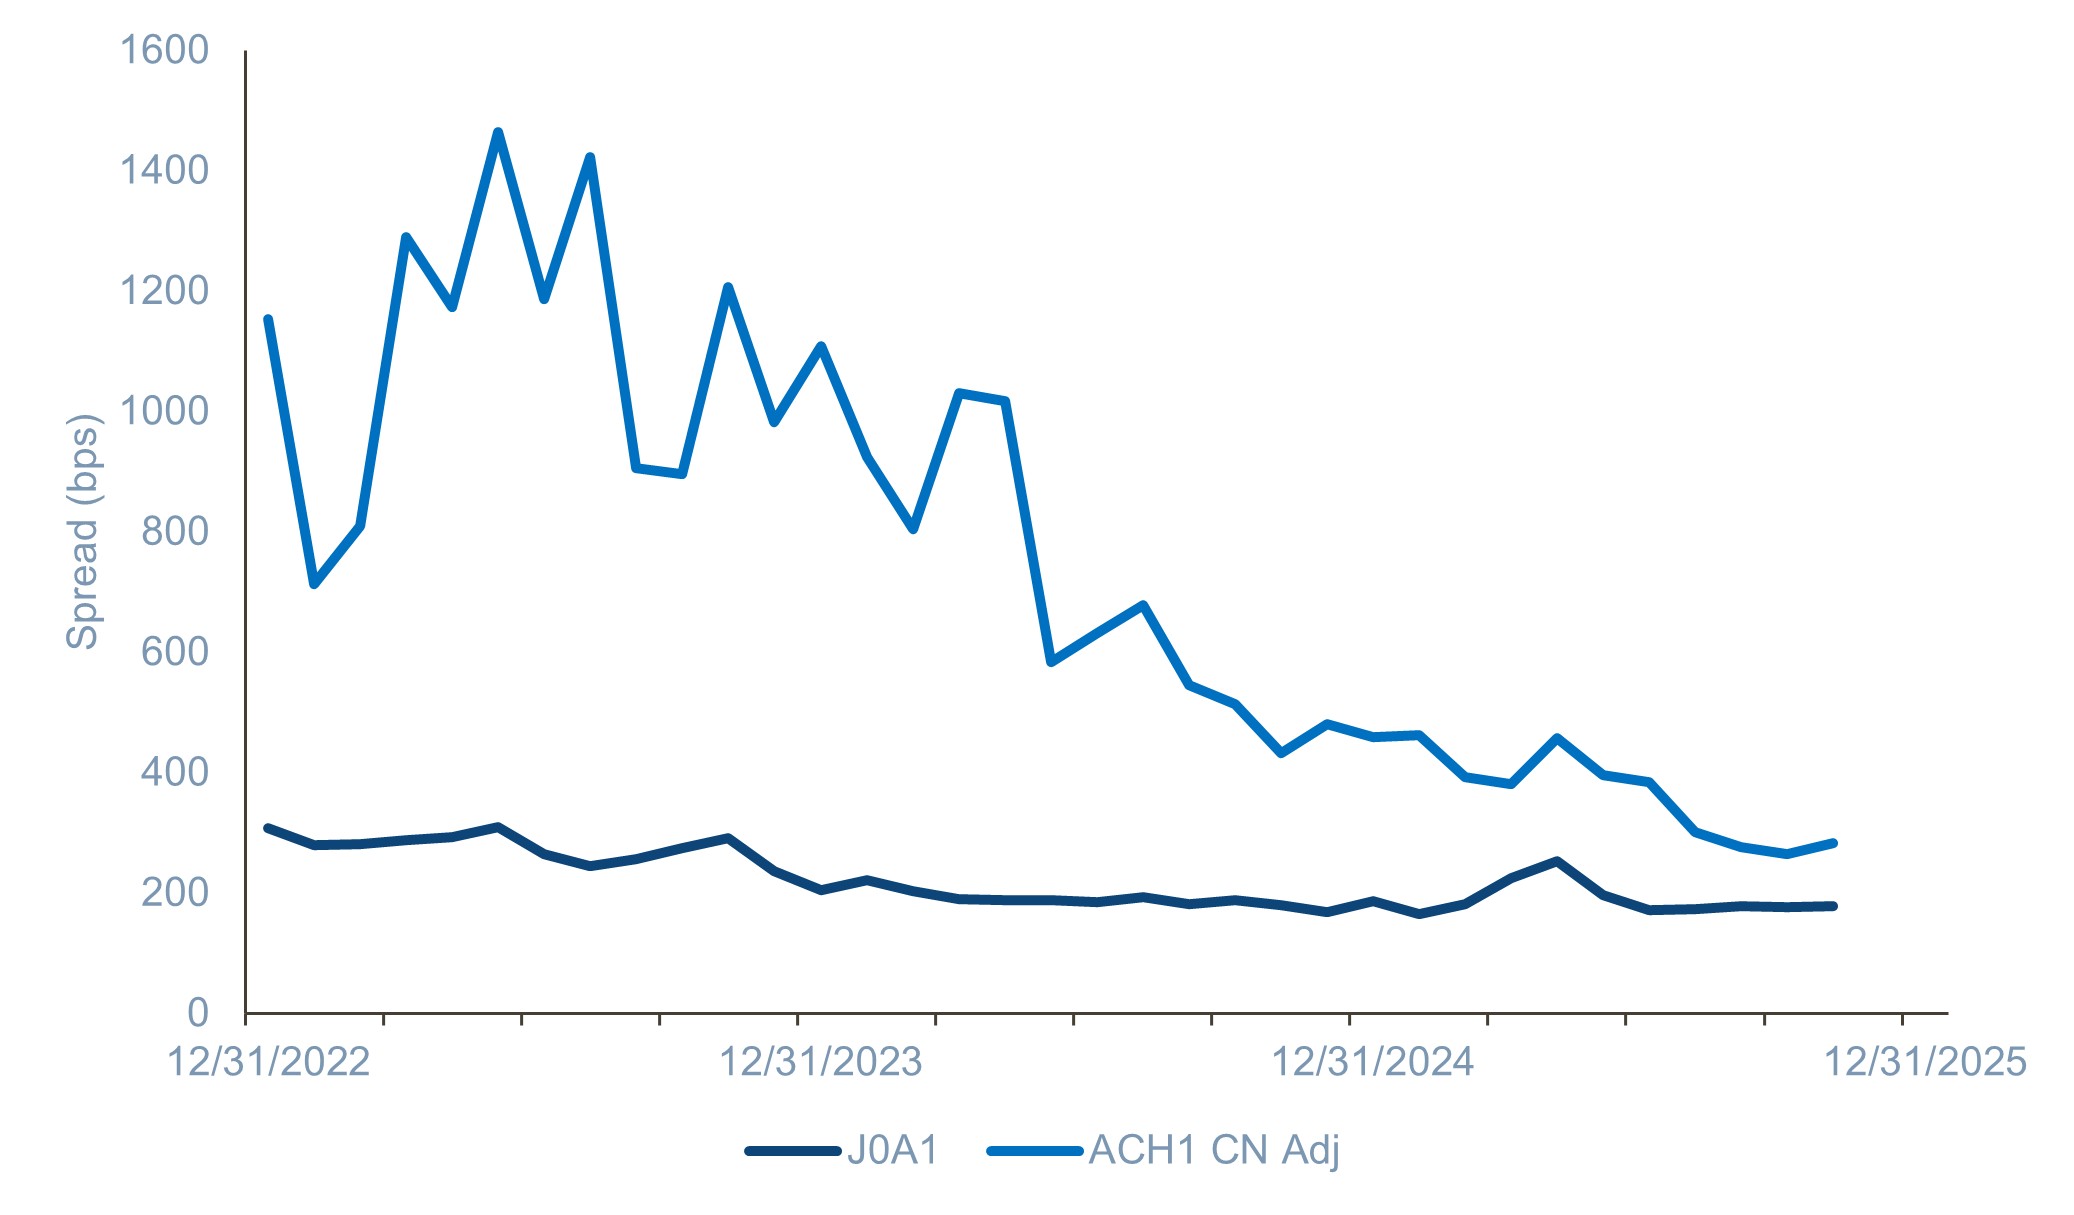
Source: ICE Index Platform, as of 31st October 2025. ICE BofA BB US Cash Pay High Yield Index (J0A1), ICE BofA Asian Dollar High Yield Corporate China Index (ACH1). Indices used represent best proxy to highlight spread changes of US and China HY markets. For illustrative purposes only. You cannot invest directly in the index.
Stability of returns as growth proves resilient
US-China trade tensions appear to have reached a resolution with the two sides agreeing a one-year pause on the imposition of recent export controls. Presidents Trump and Xi are slated to have further meetings in 2026.8
China’s economy continues to be export drive despite trade tensions. Exports have grown +5.3% year to date,9 and US trade has been replaced with locally-based Asia trading partners. China’s focus on upgrading its manufacturing capabilities and investment in high tech industries will necessitate increased levels of investment and funding, which could also lead to a recovery in issuance.
In the face of external challenges, we believe the Chinese economy has proven robust. While the annual growth target is likely to be revised to 4-4.5%, lower than the target in recent years of “around 5%”,10 it remains consistent with the longer-term policy goal of doubling the size of the Chinese economy by 2035.
While the weak property sector remains a challenge, we believe there is optimism around ‘new economy’ sectors (tech, IT, clean energy etc). The Hang Seng and Shenzhen Composite have been two of the best performing stock markets globally11 and we believe the associated wealth effect will be supportive to domestic consumption, particularly in sectors such as leisure, travel and consumer products.
Past performance is not a reliable indicator of current or future results.
In our view, the lack of supply from Chinese corporates in recent years has supported valuations. It’s also been a major driver of spread compression, particularly in Chinese high yield, while returns from Chinese investment grade (IG) have kept pace with their US counterparts and have produced a higher Sharpe ratio.12
Although China’s share of the Asian credit universe has declined, it still comprises over 25% of the market.13 As the predominant regional economic power, improved sentiment towards China from international investors is not only supportive to Chinese credit but bodes well for the broader Asian credit market.
EM look back – October
Market review
Past performance is not a reliable indicator of current or future results.
Country-specific news
All sources are Bloomberg unless otherwise stated.
This material is not intended to be relied upon as a forecast, research, or investment advice, and is not a recommendation, offer or solicitation to buy or sell any securities or to adopt any investment strategy. The opinions expressed by Muzinich & Co. are as of November 2025 and may change without notice.
Market Data
Credit
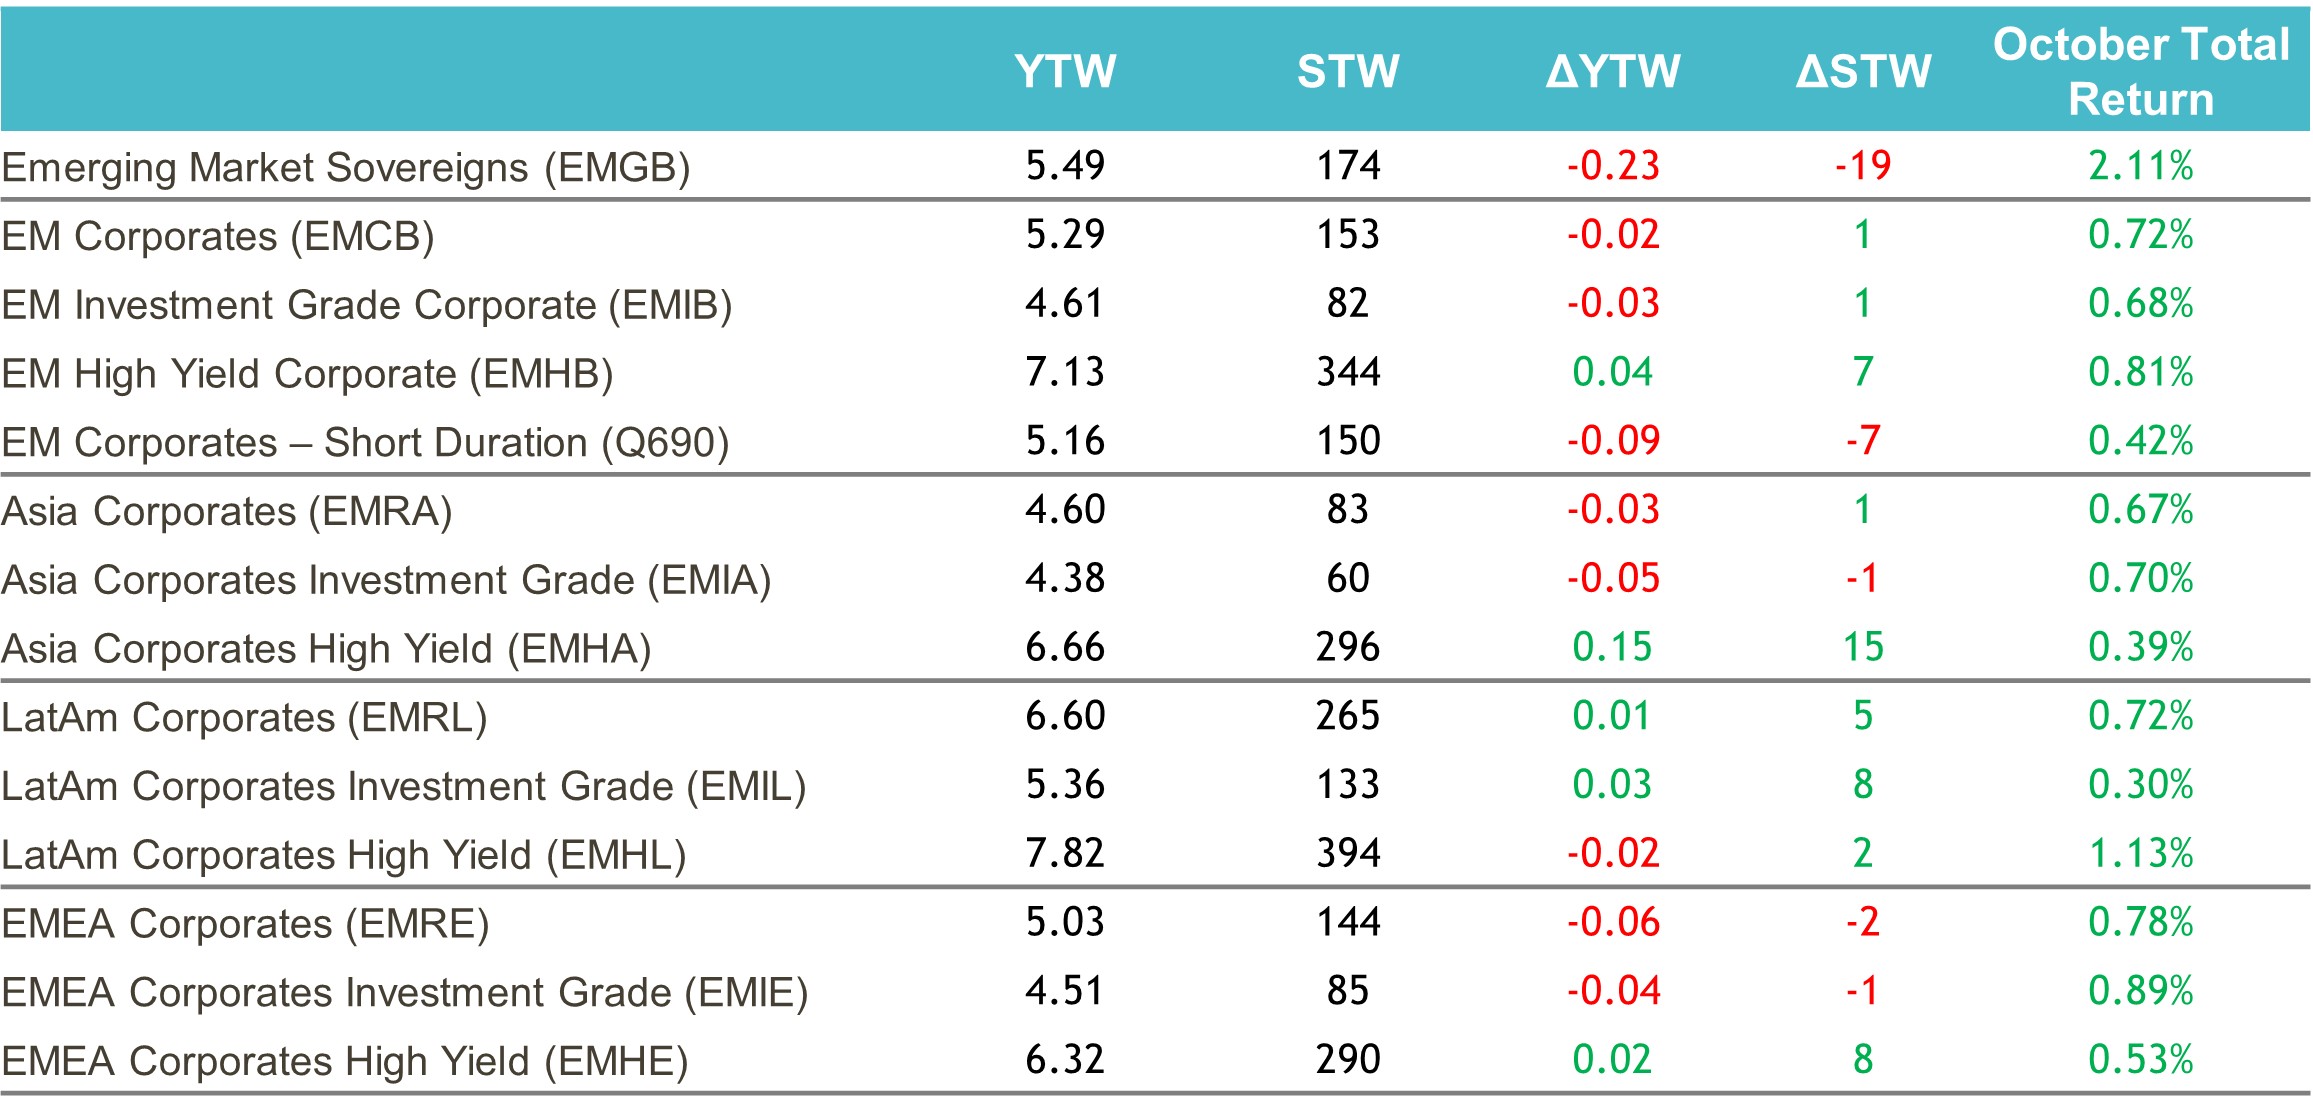
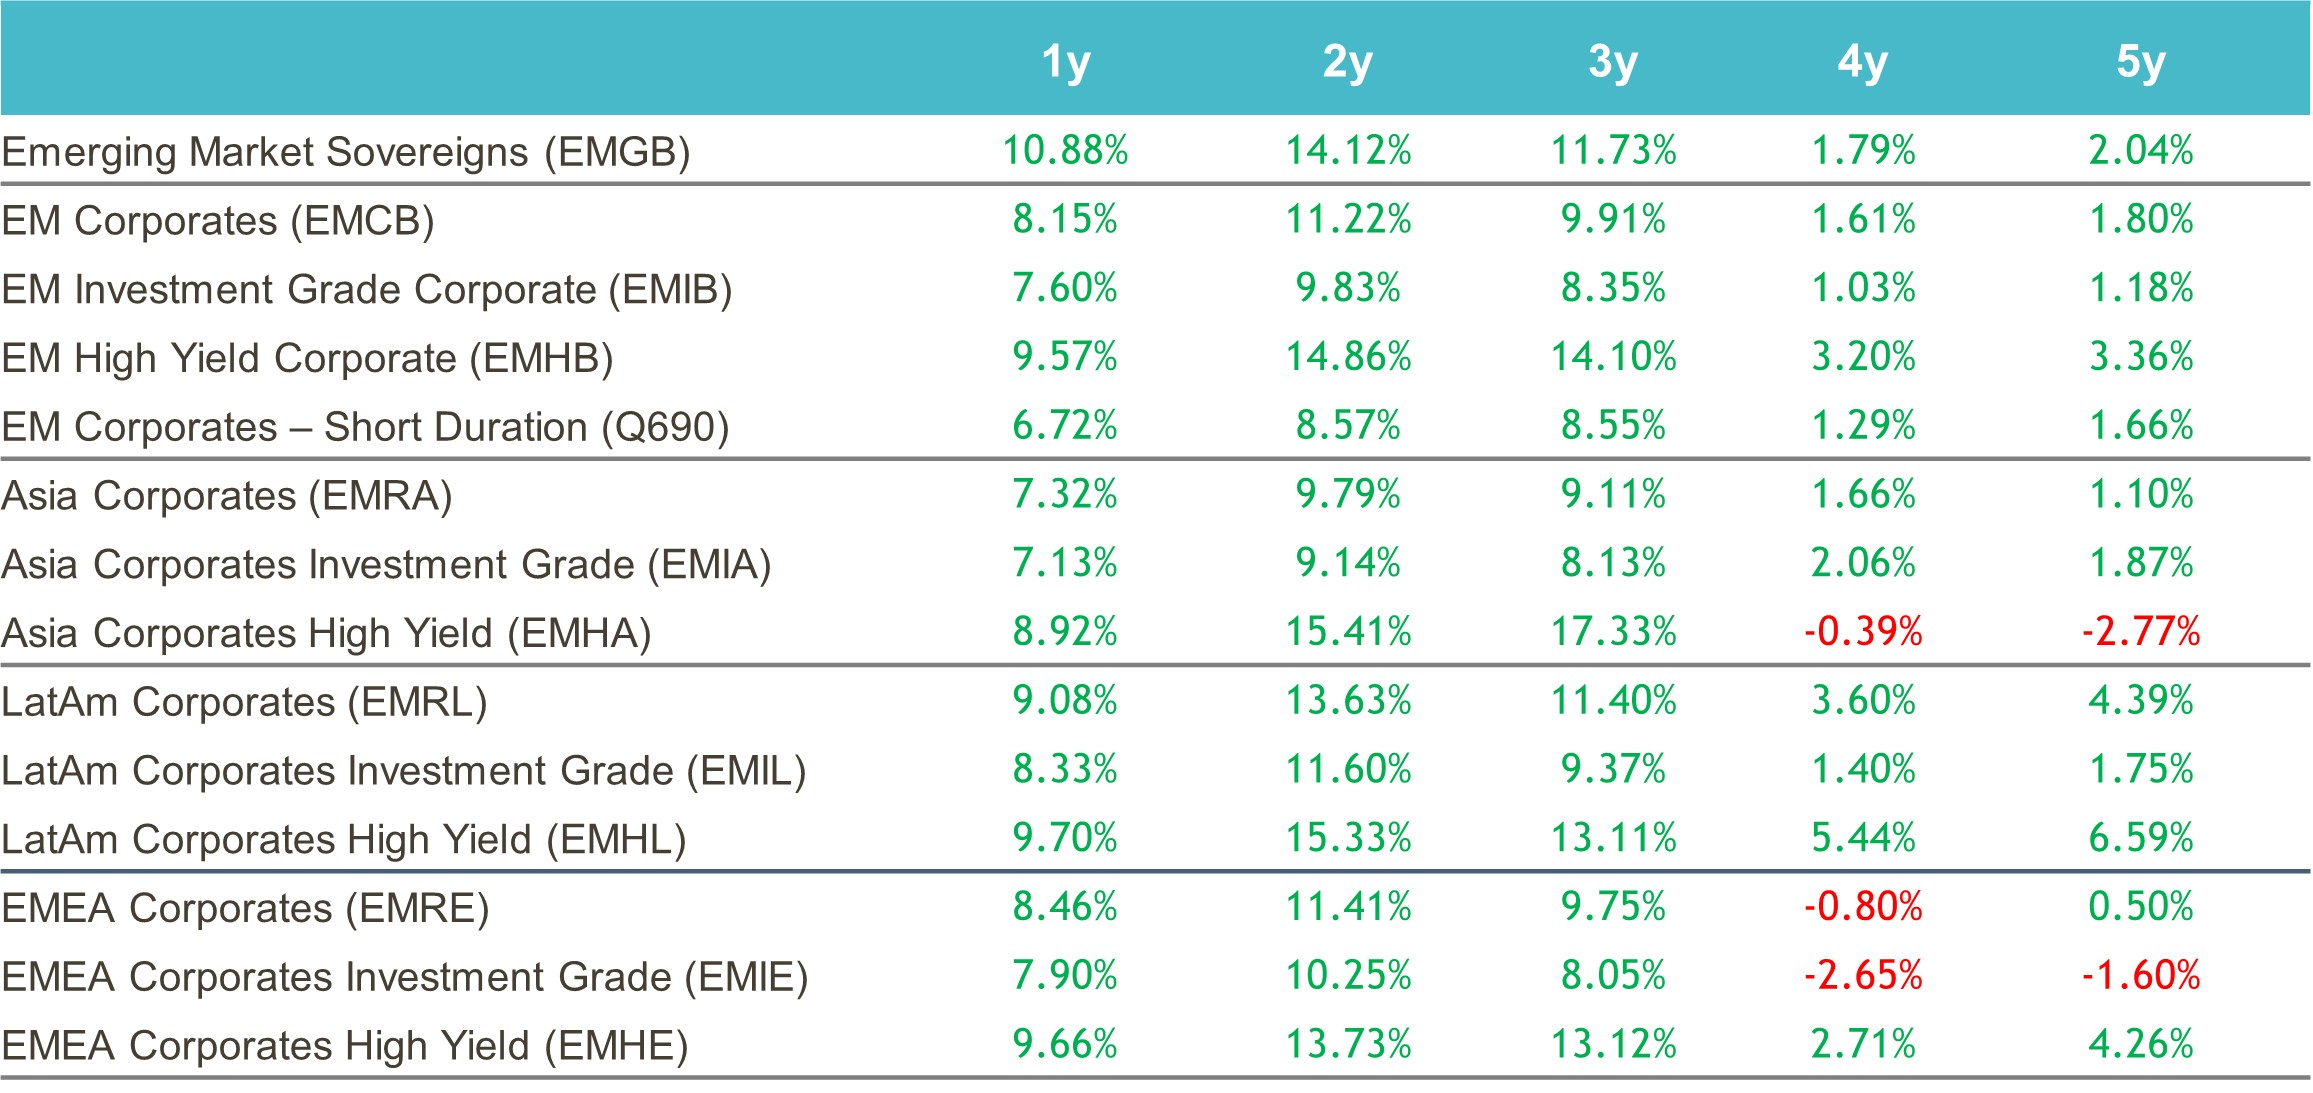 Past performance is not a reliable indicator of current or future results.
Source: ICE data platform. as of 31st October 2025. EMGB - ICE BofA Emerging Markets External Sovereign Index EMCB - ICE BofA Emerging Markets Corporate Plus Index, EMIB - ICE BofA High Grade Emerging Markets Corporate Plus Index, EMHB - ICE BofA High Yield Emerging Markets Corporate Plus Index, Q690 - ICE BofA Custom Emerging Markets Short Duration Index, EMRA - ICE BofA Asia Emerging Markets Corporate Plus Index, EMIA - ICE BofA High Grade Asia Emerging Markets Corporate Plus Index, EMHA - ICE BofA High Yield Asia Emerging Markets Corporate Plus Index , EMRL - ICE BofA Latin America Emerging Markets Corporate Plus Index, EMIL - The ICE BofA High Grade Latin America Emerging Markets Corporate Index, EMHL - ICE BofA High Yield Latin America Emerging Markets Corporate Plus, EMRE - ICE BofA EMEA Emerging Markets Corporate Plus Index, EMIE - ICE BofA High Grade EMEA Emerging Markets Corporate Plus Index, EMHE - ICE BofA High Yield EMEA Emerging Markets Corporate Plus Index,. Index performance is for illustrative purposes only. You cannot invest directly in the index. Indices selected provide best proxy for highlighting performance of emerging market corporate bonds. For illustrative purposes only.
Yield to Worst
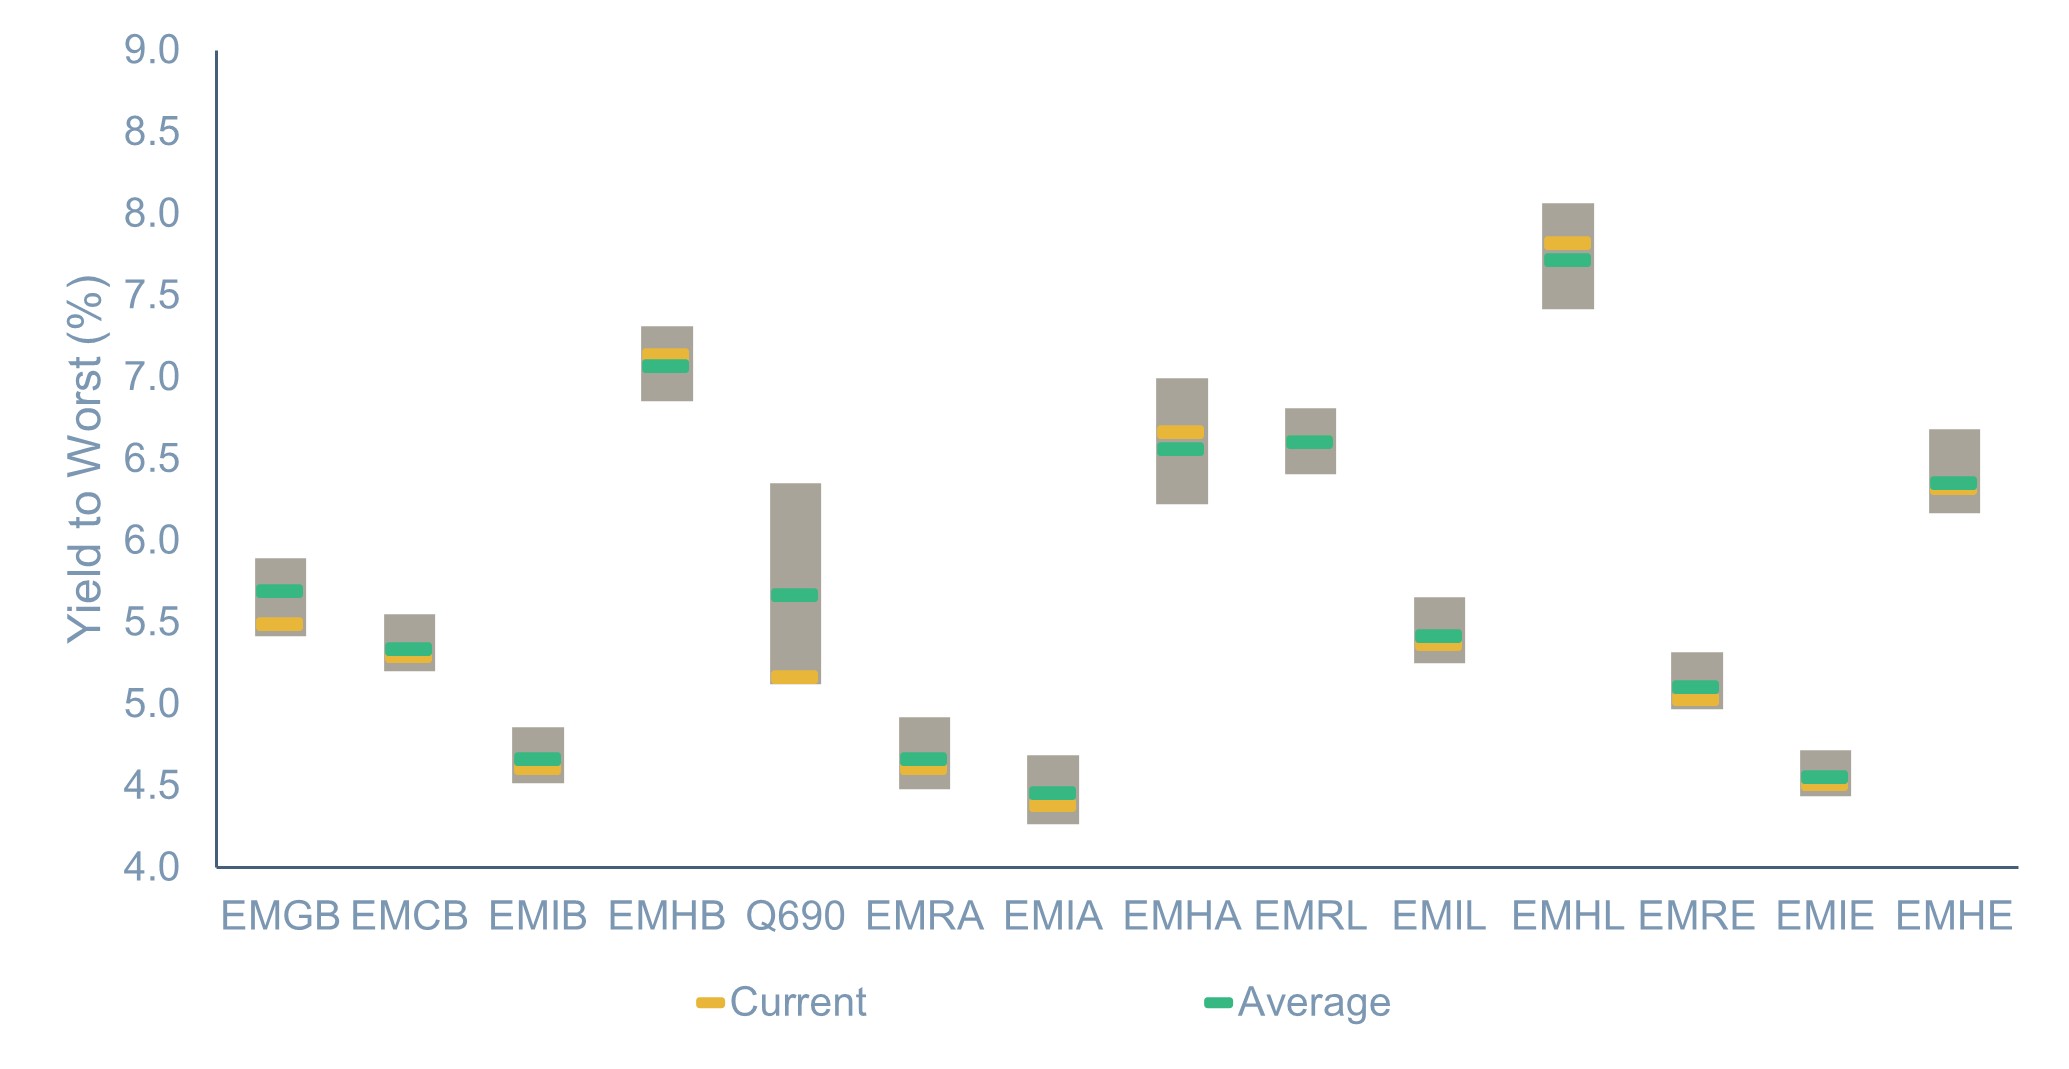 Source: ICE data platform. as of 31st October 2025. EMGB - ICE BofA Emerging Markets External Sovereign Index EMCB - ICE BofA Emerging Markets Corporate Plus Index, EMIB - ICE BofA High Grade Emerging Markets Corporate Plus Index, EMHB - ICE BofA High Yield Emerging Markets Corporate Plus Index, Q690 - ICE BofA Custom Emerging Markets Short Duration Index, EMRA - ICE BofA Asia Emerging Markets Corporate Plus Index, EMIA - ICE BofA High Grade Asia Emerging Markets Corporate Plus Index, EMHA - ICE BofA High Yield Asia Emerging Markets Corporate Plus Index , EMRL - ICE BofA Latin America Emerging Markets Corporate Plus Index, EMIL - The ICE BofA High Grade Latin America Emerging Markets Corporate Index, EMHL - ICE BofA High Yield Latin America Emerging Markets Corporate Plus, EMRE - ICE BofA EMEA Emerging Markets Corporate Plus Index, EMIE - ICE BofA High Grade EMEA Emerging Markets Corporate Plus Index, EMHE - ICE BofA High Yield EMEA Emerging Markets Corporate Plus Index,. Index performance is for illustrative purposes only. You cannot invest directly in the index. Indices selected provide best proxy for highlighting performance of emerging market corporate bonds. For illustrative purposes only.
References
1. South China Morning Post, as of 30th September 2025. “Chinese stocks set records as Beijing stimulus fuels US$1.8trn rush into bull market.”
2. The Business Times, as of 20th July 2025. “Chinese mega listings catapult Hong Kong to top spot in global markets for IPOs in H1 2025.”
3. CNN Business, as of 27th January 2025. “A shocking Chinese AI advancement called DeepSeek is sending US stocks plunging.”
4. BBC News, as of 30th October 2025. Trump lowers tariffs on China and announces end to ‘rare earths roadblock’ after Xi meeting.
5. ICE Index Platform, as of 4th November 2025. ICE BofA US Corporate Index (C0A0), ICE BofA China Investment Grade Index (CN0C).
6. ICE Index Platform, as of 4th November 2025. ICE BofA China Investment Grade Index (CN0C).
7. ICE Index Platform, as of 31st October 2025. ICE BofA China High Yield Index.
8. Channel News Asia, as of 5th November 2025. “Commentary: US and China as co-equals?”
9. CNBC, as of 6th November 2025. “China’s exports unexpectedly contract in October as shipments to US drop 25%”
10.The Business Times, as of 31st October 2025. “China targets 4.17% average annual GDP growth over next decade to reach middle-developed status.”
11.Bloomberg, as of 31st October 2025. Shenzhen Stock Exchange Composite Index.
12. ICE Index Platform, as of 31st October 2025. ICE BofA Asian Dollar High Yield Corporate China Index (ACH1), ICE BofA Asian Dollar Investment Grade Corporate China Index (ECN1).
13. ICE Index Platform, as of 31st October 2025. ICE BofA Asian Dollar Index (ADOL).
Index descriptions
EMGB - ICE BofA Emerging Markets External Sovereign Index tracks the performance of US dollar and euro denominated emerging markets sovereign debt publicly issued in the major domestic and eurobond markets. Qualifying securities must have risk exposure to countries other than members of the FX-G10, all Western European countries and territories of the US and Western European countries.
EMCB - ICE BofA Emerging Markets Corporate Plus Index tracks the performance of the US dollar and euro denominated emerging markets non-sovereign debt publicly issued in the major domestic and eurobond markets. Qualifying issuers must have risk exposure to countries other than members of the FX G10, all Western European countries, and territories of the US and Western European countries.
EMIB - ICE BofA High Grade Emerging Markets Corporate Plus Index is a subset of the ICE BofA ML Emerging Markets Corporate Plus Index (EMCB) including all securities rated AAA through BBB3, inclusive.
EMHB - ICE BofA High Yield Emerging Markets Corporate Plus Index is a subset of the ICE BofA ML Emerging Markets Corporate Plus Index (EMCB) including all securities rated BB1 or lower.
Q690 - ICE BofA Custom Emerging Markets Short Duration Index tracks the performance of short-term US dollar and euro denominated emerging markets non-sovereign debt publicly issued in the major domestic and eurobond markets.
EMRA - ICE BofA Asia Emerging Markets Corporate Plus Index is the subset of the ICE BofAML Emerging Markets Corporate Plus Index, which includes only securities issued by countries associated with the region of Asia, excluding Kazakhstan, Kyrgyzstan, Tajikistan, Turkmenistan, and Uzbekistan.
EMHA – The ICE BofA High Yield Asia Emerging Markets Corporate Plus Index is a subset of ICE BofA Emerging Markets Corporate Plus Index including all securities rated BB1 and lower with a country of risk within the Asia region.
EMIA - The ICE BofA High Grade Asia Emerging Markets Corporate Plus Index is a subset of ICE BofA Emerging Markets Corporate Plus Index including all securities rated BBB3 and higher with a country of risk within the Asia region.
EMRL - ICE BofA Latin America Emerging Markets Corporate Plus Index is a subset of The ICE BofA Emerging Markets Corporate Plus Index including all securities issued by countries associated with the geographical region of Latin America.
EMIL - The ICE BofA High Grade Latin America Emerging Markets Corporate Index is a subset of ICE BofA Emerging Markets Corporate Plus Index including all securities rated BBB3 and higher with a country of risk within the Latin America region.
EMHL - ICE BofA High Yield Latin America Emerging Markets Corporate Plus is a subset of ICE BofA Emerging Markets Corporate Plus Index including all securities rated sub-investment grade based on the average of Moody's, S&P and Fitch, and with a country of risk associated with the geographical region of Latin America.
EMRE - ICE BofA EMEA Emerging Markets Corporate Plus Index is a subset of The ICE BofA Emerging Markets Corporate Plus Index including all securities issued by countries associated with the geographical region of Europe, the Middle East and Africa including Kazakhstan, Kyrgyzstan, Tajikistan, Turkmenistan and Uzbekistan.
EMIE - ICE BofA High Grade EMEA Emerging Markets Corporate Plus Index is a subset of ICE BofA Emerging Markets Corporate Plus Index including all securities rated BBB3 and higher with a country of risk within the Europe, Middle East and Africa regions.
EMHE - ICE BofA High Yield EMEA Emerging Markets Corporate Plus Index is a subset of ICE BofA Emerging Markets Corporate Plus Index including all securities rated BBB3 and higher with a country of risk within the Europe, Middle East and Africa regions.
The MSCI EM Index is a free-float weighted equity index that captures large and mid cap representation across emerging market countries. The index covers approximately 85% of the free float-adjusted market capitalisation in each country.
LDMP - ICE BofA Local Debt Markets Plus Index is designed to track the performance of emerging markets sovereign debt publicly issued and denominated in the issuer's own currency.
J0A0 - The ICE BofA ML US Cash Pay High Yield Index tracks the performance of US dollar denominated below investment grade corporate debt, currently in a coupon paying period that is publicly issued in the US domestic market.
C0A0 - The ICE BofA ML US Corporate Index tracks the performance of US dollar denominated investment grade corporate debt publicly issued in the US domestic market.
HE00 - The ICE BofA ML Euro High Yield Index tracks the performance of EUR dominated below investment grade corporate debt publicly issued in the euro domestic or eurobond markets.
ER00 – The ICE BofA ML Euro Corporate Index tracks the performance of EUR denominated investment grade corporate debt publicly issued in the eurobond or Euro member domestic markets.
ICE BofA High Yield Emerging Markets Corporate Plus India Issuers Index (EINH) - is a subset of ICE BofA Emerging Markets Corporate Plus Index
ADHY - ICE BofA Asian Dollar High Yield Index tracks the performance of sub-investment grade U.S. dollar denominated sovereign, quasi-government, corporate, securitized and collateralized debt publicly issued in the U.S. domestic and eurobond markets by Asian issuers.
ADIG - ICE BofA Asian Dollar Investment Grade Index tracks the performance of investment grade U.S. dollar denominated sovereign, quasi-government, corporate, securitized and collateralized debt publicly issued in the U.S. domestic and eurobond markets by Asian issuers. Qualifying securities have a country of risk classified as an Emerging Markets country that is part of the Asia/Pacific Region.
CEMBI Broad Div. Index - The JP Morgan CEMBI Broad Diversified Index (CEMBIB Div) is a benchmark that tracks the performance of US dollar-denominated, fixed and floating-rate debt instruments issued by emerging market corporate entities.
JESG CEMBI Broad Div. Index - The JP Morgan ESG CEMBI Broad Diversified Custom Maturity Index tracks liquid, US Dollar denominated emerging market fixed and floating-rate debt instruments issued by corporates.
EM3B – ICE BofA BB Emerging Markets Corporate Plus Index is a subset of the ICE BofA Emerging Markets Corporate Plus Index including ass securities rated BB1 through BB3, inclusive.
EMCS – ICE BofA Emerging Markets Corporate Plus Consumer Index is a subset of ICE BofA Emerging Markets Corporate Plus Index including all securities of Consumer Cyclical and Consumer Non-Cyclical issuers.
EMEN – ICE BofA Emerging Market Corporate Plus Energy Index is a subset of ICE BofA Emerging Markets Corporate Plus Index including all securities of Energy issuers.
EMRB – ICE BofA Emerging Market Corporate plus Real Estate, Building & Hotels Index is a subset of ICE BofA Emerging Markets Corporate Plus Index including all securities of Real Easte, Building & Construction, or Hotels.
EMCG – ICE BofA Emerging Markets Corporate Plus Capital Goods Index is a subset of ICE BofA Emerging Markets Corporate Plus Index including all securities of Capital Goods Issuers.
EMSD – ICE BofA Emerging Markets Diversified Corporate Index tracks the performance of USD dollar denominated emerging markets corporate senior and secured debt publicly issued in the US domestic and eurobond markets.
EMTM – ICE BofA Emerging Markets Corporate Plus Media & Telecommunications Index is a subset of ICE BofA Emerging Markets Corporate Plus index including all securities of media and telecommunications issuers.
EM2B – ICE BofA BBB Emerging Markets Corporate Plus Index is a subset of the ICE BofA Emerging Market Corporate Plus index including all securities rated BBB1 through BBB3, inclusive.
EMUT – the ICE BofA Emerging Markets Corporate Plus Utility Index is a subset of the ICE BofA Emerging Markets Corporate Plus Index including all securities of Utility issuers.
EMPB – ICE BofA Public Sector Issuers Emerging Markets Corporate Plus Index is a subset of The BofA Emerging Markets Corporate Plus Index including all quasi-government securities as well as debt of corporate issuers deemed to be government owned or controlled.
ACIG – ICE BofA Asian Dollar Investment Grade Corporate Index tracks the performance of investment grade US dollar denominated securities issued by Asian corporate issuers in the US domestic and eurobonds market. Qualyfying securities have a country of risk associated with Bangladesh, Bhutan, Cambodia, China, John Kong, India, Indonesia, Laos, Macau, Malaysia, Mongolia, Myanmar, Nepal, Pakistan, Papua New Guinea, Philippines, Singapore, South Korea, Sri Lanka, Taiwan, Thailand and Vietnam.
EMAB – Ice BofA Automotive & Basic Industry Emerging Markets Corporate Plus Index is a subset of the ICE BofA Emerging Markets Corporate Plus Index.
EMHE - The ICE BofA High Yield EMEA Emerging Markets Corporate Plus Index is a subset of ICE BofA Emerging Markets Corporate Plus Index including all securities rated BBB3 and higher with a country of risk within the Europe, Middle East and Africa regions.
EMNS – The ICE BofA Non-Financial Emerging Markets Corporate Plus Index is a subset of the ICE BofA Emerging Markets Corporate Plus Index excluding all financial securities as well as debt of corporate issuers designated as government owned or controlled by ICE BofA emerging markets credit research.
EM1B – the ICE BofA AAA-A Emerging Markets Corporate Plus Index is a subset of the ICE BofA Emerging Market Corporate Plus Index including all securities rated AAA through A3, inclusive.
including all securities with India as the country of risk that are rated sub-investment grade based on average of Moody's, S&P and Fitch
ADOL -The ICE BofA Asian Dollar Index tracks the performance of U.S. dollar denominated sovereign, quasi-government, corporate, securitized and collateralized debt publicly issued in the U.S. domestic and eurobond markets by Asian issuers.
ICE BofA China Corporate Index (CN0C) ICE BofA China Corporate Index tracks the performance of CNY denominated corporate debt issued in the Chinese domestic bond market. Qualifying securities must have at least one year remaining term to final maturity, at least 18 months to final maturity at point of issuance, a fixed coupon schedule and a minimum amount outstanding of CNY 500 million. Callable perpetual securities qualify provided they are at least one year from the first call date. Fixed-to-floating rate securities also qualify provided they are callable within the fixed rate period and are at least one year from the last call prior to the date the bond transitions from a fixed to a floating rate security. Contingent capital securities (“cocos”) are excluded, but capital securities where conversion can be mandated by a regulatory authority, but which have no specified trigger, are included. Other hybrid capital securities, such as those issues that potentially convert into preference shares, those with both cumulative and non-cumulative coupon deferral provisions, and those with alternative coupon satisfaction mechanisms, are also included in the index. Securities in legal default are excluded from the Index.
ICE BofA Investment Grade Emerging Markets Corporate Plus China Issuers Index (ECNI) ICE BofA Investment Grade Emerging Markets Corporate Plus China Issuers Index is a subset of ICE BofA Emerging Markets Corporate Plus Index including all securities with China as the country of risk that are rated investment grade based on average of Moody's, S&P and Fitch. EMFN – EM Corporate Plus Financial is a subset of ICE BofA Emerging Markets Corporate Plus Index including all securities of financial issuers.
EMIE - The ICE BofA High Grade EMEA Emerging Markets Corporate Plus Index is a subset of ICE BofA Emerging Markets Corporate Plus Index including all securities rated BBB3 and higher with a country of risk within the Europe, Middle East and Africa regions.
EM4B – ICE BofA B & Lower Emerging Markets Corporate Plus Index is a subset of the ICE BofA Emerging Markets Corporate Plus Index.
EMRT – ICE BofA Emerging Markets Corporate Plus Transportation Index is a subset of ICE BofA Emerging Markets Corporate Plus Index including all securities of Transportation issuers other than airlines or railroads.
GSFCI - The Goldman Sachs Financial Conditions Index is a measure that assesses the overall financial conditions in the economy, taking into account various factors such as interest rates, credit spreads, and equity prices.
You cannot invest directly in an index, which also does not take into account trading commissions or costs. Additionally, indices do not include reinvestment of dividends, and the volatility of indices may be materially different over time.
--------
Important information
Muzinich and/or Muzinich & Co. referenced herein is defined as Muzinich & Co., Inc. and its affiliates. Muzinich views and opinions. This material has been produced for information purposes only and as such the views contained herein are not to be taken as investment advice. Opinions are as of date of publication and are subject to change without reference or notification to you. Past performance is not a reliable indicator of current or future results and should not be the sole factor of consideration when selecting a product or strategy. The value of investments and the income from them may fall as well as rise and is not guaranteed and investors may not get back the full amount invested. Rates of exchange may cause the value of investments to rise or fall.
Any research in this document has been obtained and may have been acted on by Muzinich for its own purpose. The results of such research are being made available for information purposes and no assurances are made as to their accuracy. Opinions and statements of financial market trends that are based on market conditions constitute our judgment and this judgment may prove to be wrong. The views and opinions expressed should not be construed as an offer to buy or sell or invitation to engage in any investment activity, they are for information purposes only.
This discussion material contains forward-looking statements, which give current expectations of future activities and future performance. Any or all forward-looking statements in this material may turn out to be incorrect. They can be affected by inaccurate assumptions or by known or unknown risks and uncertainties. Although the assumptions underlying the forward-looking statements contained herein are believed to be reasonable, any of the assumptions could be inaccurate and, therefore, there can be no assurances that the forward-looking statements included in this discussion material will prove to be accurate. In light of the significant uncertainties inherent in the forward-looking statements included herein, the inclusion of such information should not be regarded as a representation that the objectives and plans discussed herein will be achieved. Further, no person undertakes any obligation to revise such forward-looking statements to reflect events or circumstances after the date hereof or to reflect the occurrence of unanticipated events.
United States: This material is for Institutional Investor use only – not for retail distribution. Muzinich & Co., Inc. is a registered investment adviser with the Securities and Exchange Commission (SEC). Muzinich & Co., Inc.’s being a Registered Investment Adviser with the SEC in no way shall imply a certain level of skill or training or any authorization or approval by the SEC.
Issued in the European Union by Muzinich & Co. (Ireland) Limited, which is authorized and regulated by the Central Bank of Ireland. Registered in Ireland, Company Registration No. 307511. Registered address: 32 Molesworth Street, Dublin 2, D02 Y512, Ireland. Issued in Switzerland by Muzinich & Co. (Switzerland) AG. Registered in Switzerland No. CHE-389.422.108. Registered address: Tödistrasse 5, 8002 Zurich, Switzerland. Issued in Singapore and Hong Kong by Muzinich & Co. (Singapore) Pte. Limited, which is licensed and regulated by the Monetary Authority of Singapore. Registered in Singapore No. 201624477K. Registered address: 6 Battery Road, #26-05, Singapore, 049909. Issued in all other jurisdictions (excluding the U.S.) by Muzinich & Co. Limited. which is authorized and regulated by the Financial Conduct Authority. Registered in England and Wales No. 3852444. Registered address: 8 Hanover Street, London W1S 1YQ, United Kingdom. 2025-11-13-17378


By clicking "Submit", I am (i) signing up to receive the Opinion Pieces from the "Opinions" page of the Muzinich & Co website, (ii) representing that the above information is true and accurate and (iii) agreeing to join the Muzinich & Co mailing list. I understand that Muzinich & Co will not add retail investors or individuals with personal email addresses to its mailing list and represent that I am not a retail investor. By providing my personal and professional information I am consenting to its use and disclosure in accordance with the Muzinich & Co. Privacy Policy. I understand that I may withdraw my consent and unsubscribe from receiving future communications by clicking "Unsubscribe" from the emails that are sent to me from Muzinich & Co.